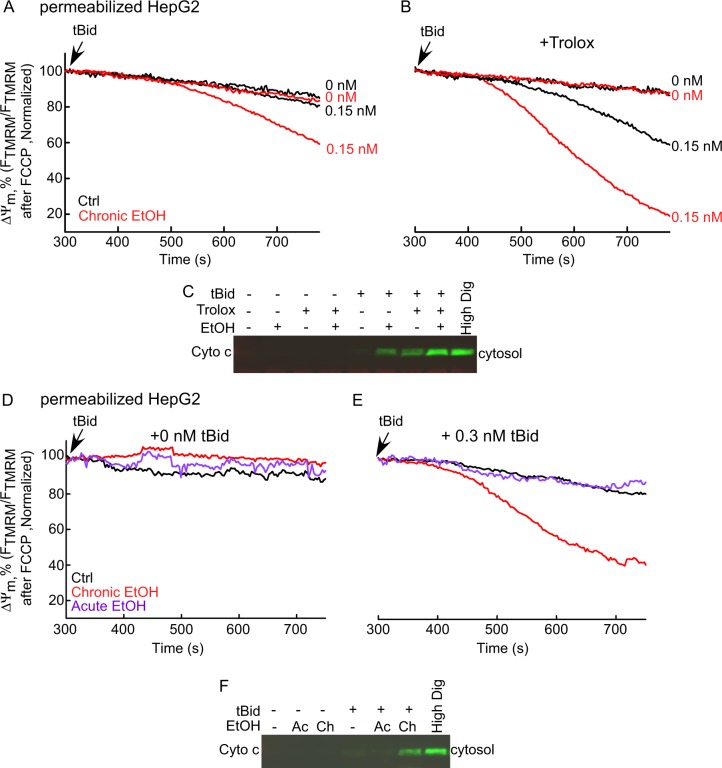
Fig. 8. Trolox does not alter the EtOH-dependent sensitization of tBid-induced OMMP in HepG2 cells.
Only chrEtOH sensitizes the cells to tBid. a Time-course graph of ΔΨm in 0 and 100mM EtOH-exposed permeabilized HepG2 cells. tBid (0 and 0.15 nM) was added at 300 s. Similar to Fig. 6b, at the end of each experiment, FCCP was added. The data are presented as the percentage of the initial ΔΨm. Arrow shows the tBid addition. b Similar as a, except that the cells have been treated with 50 μM Trolox for 72 h before the experiment and was refreshed every 24h (n = 3). c Western blot of cyto c in the cytosolic fraction of the HepG2 permeabilized samples, which were separated from the pellet at the end of each run. High concentration (600 μg/ml) of Digitonin was used to release all the cyto c in the mitochondria as positive control. d, e Mean traces of time-course recording of ΔΨm in permeabilized HepG2 cells suspension in cells chronically or acutely exposed to 100 mM ethanol (n = 3). tBid concentration was either zero d or 0.3 nM e. At the end of each experiment, FCCP (5 μM) was added to depolarize the remaining ΔΨm. The data are presented as the percentage of the initial ΔΨm. Arrow shows the tBid addition. Black, red, and purple traces are control, chronically and acutely EtOH-treated in order. f Western blot of cyto c

