Figure 5.

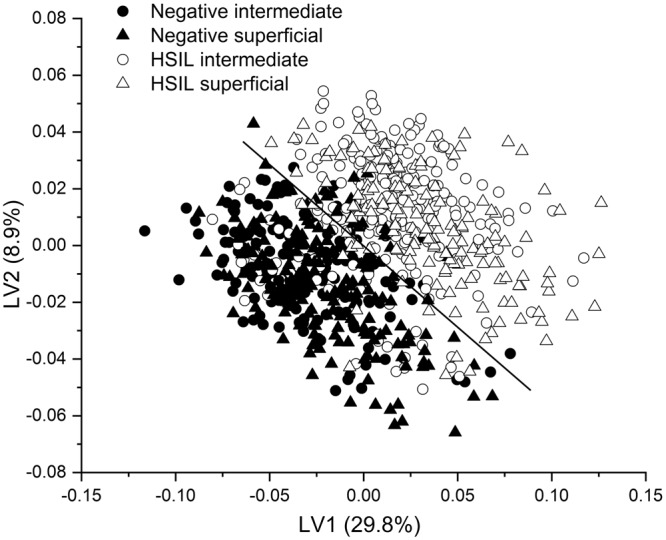
Scatter plot of the significant latent variables (LVs) obtained from the Raman spectral dataset of mixed intermediate and superficial cells of negative cytology and high-grade squamous intraepithelial lesion (HSIL) cytology specimens.

Scatter plot of the significant latent variables (LVs) obtained from the Raman spectral dataset of mixed intermediate and superficial cells of negative cytology and high-grade squamous intraepithelial lesion (HSIL) cytology specimens.