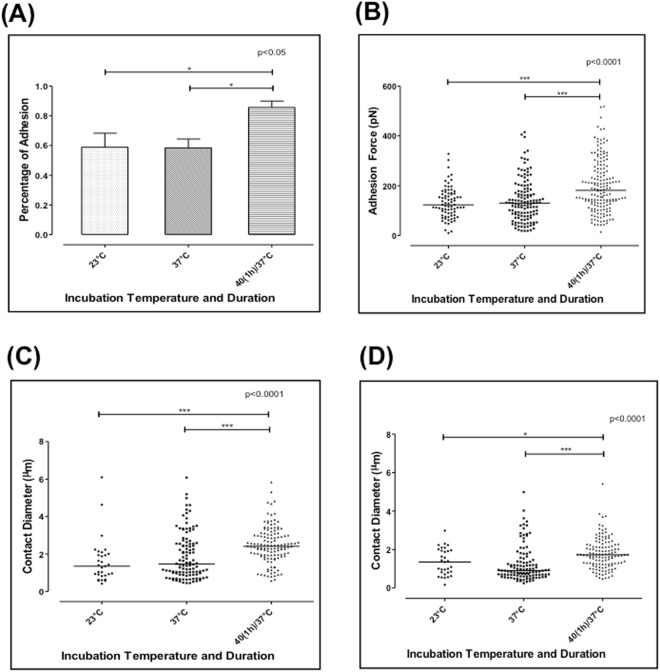
Figure 2.
(A) Percentage of adhesion measured at 23 °C, 37 °C, and after 1 h or 2 h incubation at 40 °C (n = 5). (B) The adhesion force measured at 23 °C, 37 °C, and after 1 h incubation at 40 °C. (C) The initial contact diameter measured at 23 °C, 37 °C, and after 1 h incubation at 40 °C. (D) The final contact diameter before the two cells were separated, measured at 23 °C, 37 °C and after 1 h incubation at 40 °C. Each point in (B), (C) and (D) represents the adhesion force of one cell pair, and the bar represents the median value of each data set. Krauskal-Wallis Test and Dunn’s post hoc test.

