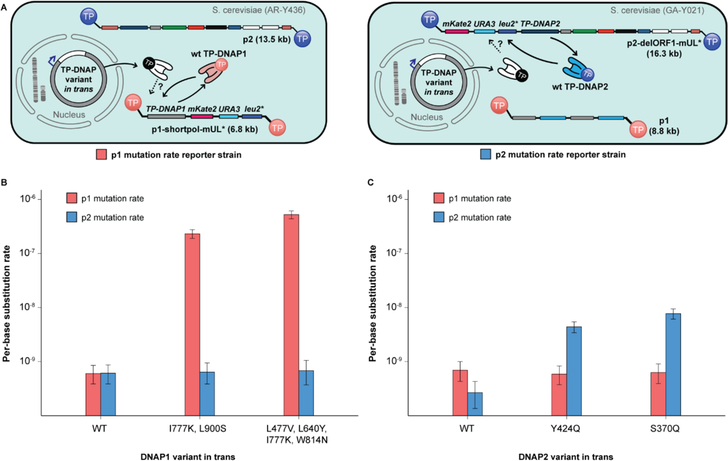
Figure 3. Mutual orthogonality between p1 and p2 replication.
(A) Schematics detailing strains for measuring p1 mutation rate (left, red) and measuring p2 mutation rate (right, blue). Left: p1 mutation rate reporter strains derived from AR-Y304 encode mKate2, URA3 and leu2* on p1, enabling measurement of p1 copy number and mutation rate in presence of TP-DNAP variants in trans. Right: p2 mutation rate reporter strains derived from GA-Y021 encode mKate2, URA3 and leu2* on p2, enabling measurement of p2 copy number and mutation rate in presence of TP-DNAP variants in trans. (B) Mutagenic TP-DNAP1 variants increase p1 mutation rate (red) by 380- and 870-fold, without any increase in p2 mutation rate (blue). (C) Mutagenic TP-DNAP2 variants increase p2 mutation rate by 16- and 29-fold, without a similar increase in p1 mutation rate. Error bars correspond to 95% confidence intervals calculated according to the MSS method.17–19 See Table S2 for exact mutation rate values.

