Figure 5.
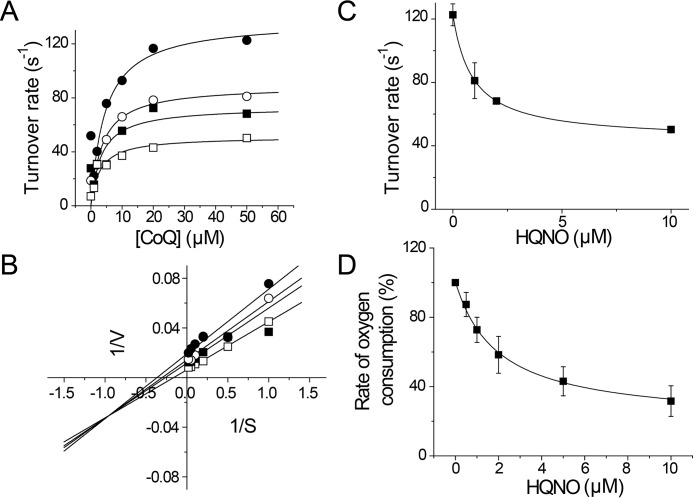
HQNO inhibition mechanism of Pa-NQR and P. aeruginosa membranes. A, Pa-NQR activity was tested at different concentrations of ubiquinone-1 (CoQ) in the presence of increasing concentrations of HQNO (0 μm (●), 1 μm (○), 2 μm (■), and 10 μm (□)). B, Lineweaver–Burk plot of the ubiquinone versus HQNO titration data. The data shown in A and B were fitted to the equation corresponding to a partial mixed inhibitor (Equation 1). Shown is HQNO titration of Pa-NQR activity obtained at a fixed ubiquinone concentration (50 μm) (C) and of NADH (200 μm)-dependent oxygen consumption of P. aeruginosa membranes (D). Error bars, S.D.

