Figure 1.
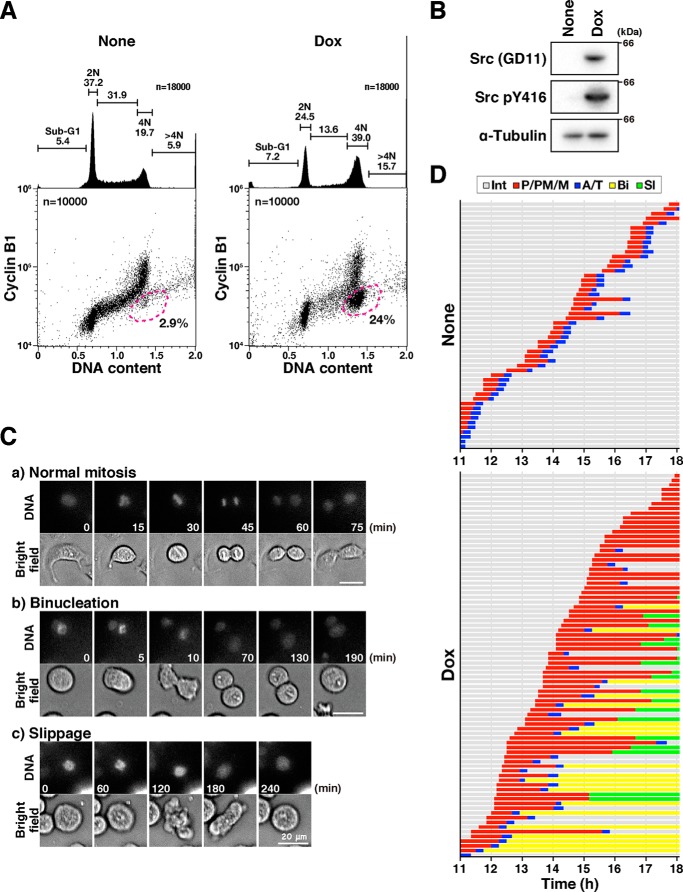
v-Src causes premature mitotic exit without cytokinesis. A, HeLa S3/v-Src cells were cultured with or without 2 ng/ml Dox for 21 h, fixed with 70% ethanol, and then stained for cyclin B1 and DNA. More than 20,000 cells were analyzed for cyclin B1 levels and DNA content by using flow cytometry. The bivariate dot plots of 10,000 cells are shown. DNA content is shown on the x axis and cyclin B1 protein level on the y axis (log scale). The regions with dashed lines include cells with 4N DNA content and lower cyclin B1 levels. The percentage of cell numbers within the region is shown. DNA histograms are shown above each bivariate plot. Peak haploid genome equivalents (2N and 4N), sub-G1 cells, S-phase cells, and polyploid cells (>4N) are indicated with their percentages. Each curve represents 18,000 cells. B, HeLa S3/v-Src cells were cultured with or without 2 ng/ml Dox for 9 h, lysed, and subjected to Western blot analysis. The blots were probed with anti-Src (GD11), anti-active Src (pY416), and anti-α-tubulin (loading control) antibodies. C and D, HeLa S3/v-Src cells were cultured with (Dox) or without (None) 2 ng/ml Dox for 11 h and then observed using time-lapse imaging for 7 h. DNA was stained with 0.1 μm Hoechst 33342 at 1 h before the beginning of the time-lapse imaging. C, selected frames show cells that exhibit normal mitosis (panel a, normal mitosis), the furrow regression after chromosome segregation (panel b, binucleation), and the mitotic exit without chromosome segregation (panel c, slippage). Scale bars, 20 μm. D, graph indicates the duration of prophase/prometaphase/metaphase (P/PM/M: from cell rounding to chromosome alignment; red), anaphase/telophase (A/T: from anaphase onset to chromosome de-condensation; blue), binucleation (Bi, interphase cells after mitotic exit with furrow regression after chromosome segregation, yellow), and slippage (Sl, interphase cells after mitotic exit without chromosome segregation and cytokinesis, green) from two independent experiments. Fifty-two and 82 M-phase cells were examined as the control and Dox-treated cells, respectively.

