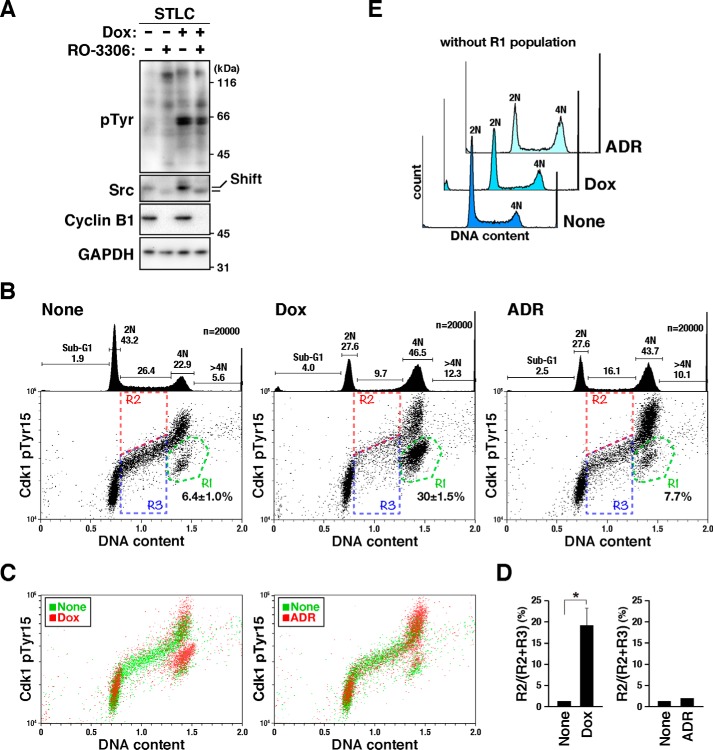
Figure 4.
v-Src phosphorylates Cdk1 at Tyr-15. A, HeLa S3/v-Src cells were cultured with 10 μm STLC for 11 h and continuously cultured with or without 2 ng/ml Dox in the presence of STLC for 5 h. Then, 10 μm RO-3306 or DMSO (solvent control) was added, and 30 min later, the cells were lysed according to the PTS method, as shown under “Experimental procedures.” The lysates were subjected to proteomic and Western blotting analyses. The blots were probed with anti-phosphotyrosine (pTyr), anti-Src (GD11), anti-cyclin B1, and anti-GAPDH (loading control) antibodies. Shift, mobility shift. B–E, HeLa S3/v-Src cells were cultured with or without 2 ng/ml Dox for 21 h, fixed with 70% ethanol, and then stained for phosphorylated Cdk1 at Tyr-15 and DNA. More than 20,000 cells were analyzed using flow cytometry. B, representative bivariate dot plots are shown. DNA content is shown on the x axis, and phosphorylated Cdk level is shown on the y axis (log scale). The regions with green lines (R1) include cells with 4N DNA content and lower levels of Cdk1 phosphorylation. The percentage of cell numbers within the region is shown as the mean ± S.D. from three independent experiments (None, Dox). For ADR treatment, the result obtained from one experiment is shown. The regions with red (R2) and blue (R3) lines include S-phase cells; R2 and R3 regions include cells positive and negative for Cdk phosphorylation at Tyr-15, respectively. DNA histograms are shown above each bivariate plot. Peak haploid genome equivalents (2N, 4N), sub-G1, S-phase, and polyploid cells (>4N) are indicated with their percentages. Each curve represents 20,000 cells. C, bivariate dot plot obtained with Dox-untreated (None, green) and Dox-treated (Dox, red) cells shown in B are overlaid. D, percentages of cells in R2 in S-phase cells were determined. Results represent the mean ± S.D. from three independent experiments (None, Dox). The asterisk indicates significant differences (*, p < 0.05) using Student's two-tailed t test. The p value between Dox-untreated and Dox-treated cells is 0.01634. The results with ADR-treated cells were obtained from one experiment. E, DNA histograms of cells, except the R1 population, in B are shown. Each curve represents 14,000 cells.

