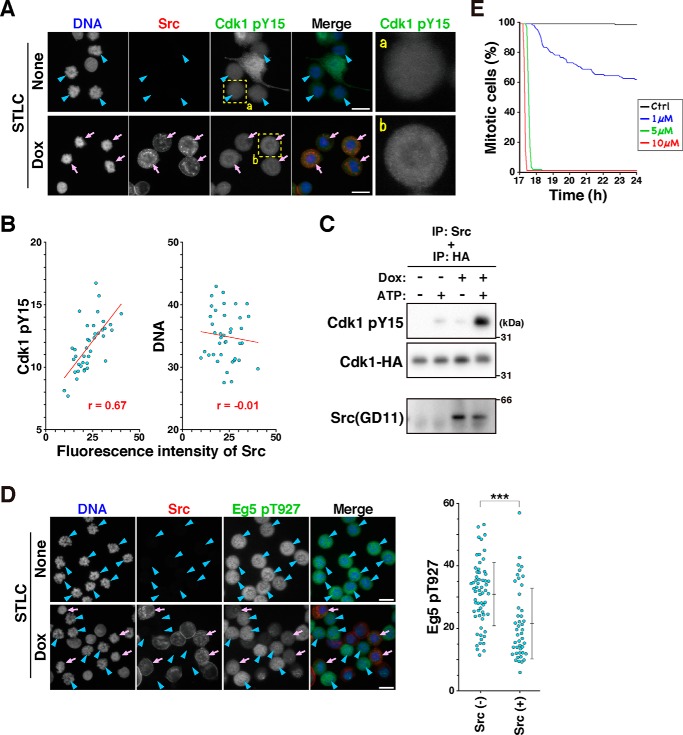
Figure 5.
v-Src–induced Cdk1 phosphorylation attenuates the kinase activity of Cdk1. A and B, HeLa S3/v-Src cells were cultured with 10 μm STLC in the presence or absence of 2 ng/ml Dox for 21 h. Then, the cells were fixed with methanol at −30 °C for 5 min and stained for Src (red), phosphorylated Cdk1 at Tyr-15 (green), and DNA (blue). A, representative images are shown. Arrows (pink) indicate M-phase cells with v-Src expression, and arrowheads (blue) indicate M-phase cells without v-Src expression. Magnified images of the areas (dashed line) are shown on the right. B, scatter plots representing the relationship between the mean fluorescence intensities of Src and phosphorylation of Cdk1 at Tyr-15 or DNA are shown. The correlation was analyzed using Pearson's correlation coefficients test. A statistically significant correlation was observed between Src expression level and Cdk1 phosphorylation at Tyr-15 (r = 0.670, p < 0.001, Pearson's correlation). The regression line is shown in the graph. C, HeLa S3/v-Src cells were cultured with or without 0.1 μg/ml Dox for 22 h and lysed with 1% Triton X-100. v-Src was immunoprecipitated (IP) from this lysate and incubated with purified Cdk1–HA from the lysate of HeLa S3 cells, which were transfected with the Cdk1–HA expression plasmid, in the presence or absence of 0.5 mm ATP at 30 °C for 30 min. The reaction mixture was analyzed with Western blotting. The blots were probed with anti-Src (GD11), anti-phospho-Cdc2 (Tyr-15), and anti-HA antibodies. D, HeLa S3 and HeLa S3/v-Src cells were mixed and cultured together in the same dishes with 10 μm STLC in the presence or absence of 2 ng/ml Dox for 21 h. Then the cells were fixed with methanol at −30 °C and stained for Src (red), phosphorylated Eg5 at Thr-927 (green), and DNA (blue). D, arrows (pink) and arrowheads (blue) show M-phase cells with and without Src expression, respectively. Scale bars, 20 μm. Mean fluorescence intensities of phosphorylated Eg5 at Thr-927 were measured using ImageJ and plotted. Two independent experiments were performed, and almost the same results were obtained. A typical result obtained from one experiment is shown as the mean ± S.D. calculated from 62 (Src-negative) and 45 (Src-positive) cells. The asterisks indicate significant differences (***, p < 0.001) using Student's two-tailed t test. The p value is 0.000022. E, HeLa S3 cells were cultured with STLC for 17 h and subjected to time-lapse imaging for 7 h in the presence of RO-3306 at the concentrations indicated in the graph. DNA was stained with 0.1 μm Hoechst 33342 at 1 h before the beginning of the time-lapse recording. Mitotic cells were tracked during the time-lapse recording. The number of mitotic cells observed at the beginning of the time-lapse recording was set as 100%, and the percentages of mitotic cells at the indicated times are shown in the graph.

