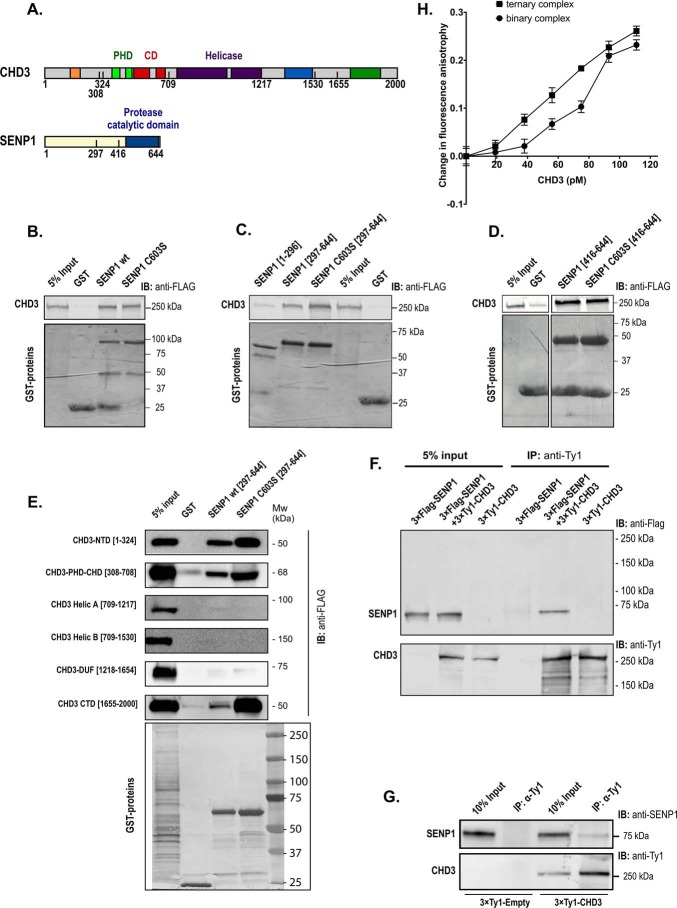
Figure 2.
CHD3 interacts with SENP1. A, human CHD3 and SENP1 are depicted with their domain structures. B–E, GST pulldown binding assays were performed with different GST protein domains and 3×FLAG–CHD3 from transfected COS-1 cells. The GST fusion proteins used were full length versions of SENP1 (panel B), and the indicated deletions of SENP1 (panels C, D, and E). In panels B, C, and D, binding of the GST proteins to full-length CHD3 was monitored, while binding to deletions of 3×FLAG-CHD3 was monitored in panel E. 24 h after transfection, the COS-1 cells were lysed in KAc-interaction buffer, and the lysates were incubated with comparable amounts of the different GST fusion proteins bound to GSH beads. The bound proteins were separated by SDS-PAGE, and the immunoblot was analyzed using anti-FLAG antibody (1:10,000) and LI-COR IRDye 680RD anti-mouse secondary antibody (1:10,000). 5% of total cell extract used for each pulldown was loaded as reference. The upper panels show the Western blots (anti-FLAG) for CHD3, and the lower panel shows the Coomassie-stained gel of the indicated GST fusion proteins. B and C are derived from the same experiment and the same gel with the common input and GST controls placed in the middle. Therefore, the controls of B are re-used in C. F, co-immunoprecipitation of SENP1 with CHD3. COS-1 cells were transfected with the indicated combinations of pCIneo-3×FLAG-SENP1 and pEF1–3×Ty1–CHD3. Whole-cell lysates were immunoprecipitated (IP) with anti-Ty1 antibody and separated by SDS-PAGE, and SENP1 was revealed by immunoblotting (IB) using anti-FLAG antibody. 5% of total transfected cell lysate was loaded as input reference. G, co-immunoprecipitation at endogenous levels of SENP1 with 3×Ty1–CHD3. The K562 nuclear extract from 3×Ty1–CHD3 (clone H6) was incubated with protein A magnetic beads coupled to an anti-Ty1 mAb (right). A nuclear extract from a 3×Ty1–Empty stable K562 cell line served as control (left). From a measure of the pixels in the bands in the upper panel, we estimated that in the right part from 3×Ty1–CHD3-expressing cells, 1.7% of the total input with endogenous SENP1 was found in the anti-Ty1 precipitate (pixels in 4th lane = 17% in 3rd lane). This is in contrast to the left control pair from 3×Ty1 empty cells where the co-IP band was only 0.01% of the total input. H, change in fluorescence anisotropy of SUMO1–AMC in complex with increasing amounts of recombinant full-length CHD3–(1994-SIMmutant) in the absence (binary complex) or presence (ternary complex) of recombinant SENP1-(C603S)(297–644). The anisotropy values were measured in the presence and absence of added protein, and the difference was plotted as indicated. In the ternary complex binding curve, the fixed concentration of SENP1-(C603S)(297–644) was 580 pm. This fixed concentration of SENP1 used for the ternary complex curve was based on a separate titration of SENP1-(C603S)(297–644) to SUMO1–AMC, where a concentration of SENP1 well below saturation was selected.

