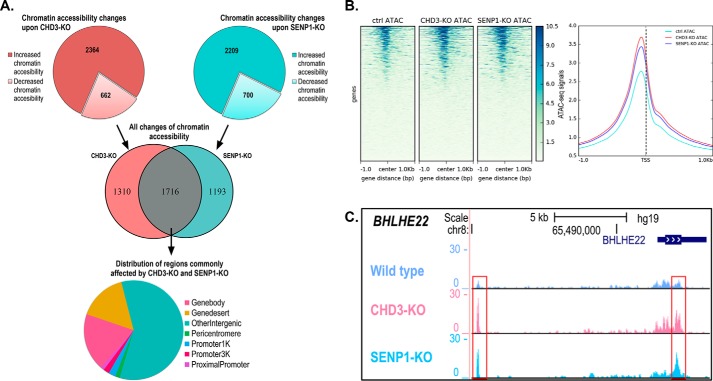
Figure 4.
Chromatin accessibility changes assayed by ATAC-Seq. A, diagrams show the regions that exhibit ≥50% fold change upon CHD3-KO and SENP1-KO with increased and decreased chromatin accessibility indicated. The Venn diagram shows the overlapping differentially accessible regions (n = 1716) between SENP1-KO (both increased and decreased) and CHD3-KO (both increased and decreased). The pie chart shows the distribution of genomic regions for the shared changes in chromatin accessibility (n = 1716). Differential chromatin accessibility was obtained by comparing with the HAP1 control cell lines. B, heatmap showing the average ATAC-Seq signal centered on the TSS of the nearest genes. Ensembl human reference genome annotation (GRCh37 release 87) was used as regions for calculating enrichment of the ATAC signal at and around the TSS. The line plot shows the intensity of the centered average ATAC signal at and ±1 kb around the TSS. The heatmap and line plot were made using deepTools2 (67). C, example ATAC track for the BHLHE22 locus showing ATAC-Seq signals for CHD3-KO and SENP1-KO as well as control cell lines. Visualization of the tracks were made using the UCSC genome browser (68).

