Figure 8.
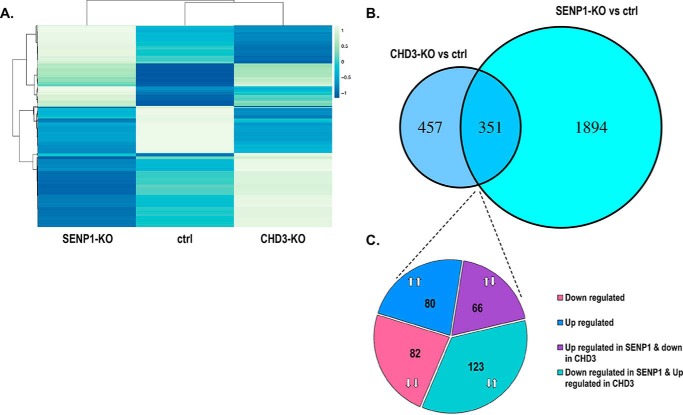
RNA-Seq changes in CHD3-KO and SENP1-KO HAP1 cells. A, heatmap showing hierarchical clustering of significant differentially regulated genes shared between SENP1-KO and CHD3-KO (n = 351), with each row representing a gene. The cluster heatmap was generated using ClustVis webtool (41). B, significant differentially regulated genes upon CHD3-KO and SENP1-KO and the intersection between them (n = 351). C, proportion of different subgroups among the shared affected genes by CHD3-KO and SENP1-KO; the number of shared genes that were both down-regulated (n = 82), both up-regulated (n = 80), up-regulated in SENP1-KO, and down-regulated in CHD3-KO (n = 66), and vice versa (n = 123). Differential gene expression was calculated using cuffdiff (69).

