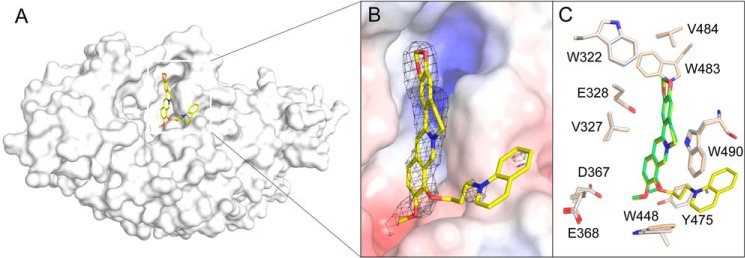
Figure 6.
Crystal structures of OfHex1 in complex with SYSU-1. A, surface representations of OfHex1 complexed with SYSU-1. B, binding mode of SYSU-1 in the active pocket of OfHex1. Electrostatic potential between −6 kT/e and 6 kT/e was shown as a colored gradient from red (acidic) to blue (basic). The 2Fo − Fc electron-density map around the ligand is contoured at the 1.0 σ level. C, superimposition of the berberine-complexed and SYSU-1–complexed OfHex1. Residues of the berberine-complexed and SYSU-1–complexed OfHex1 are shown in wheat and white, respectively.

