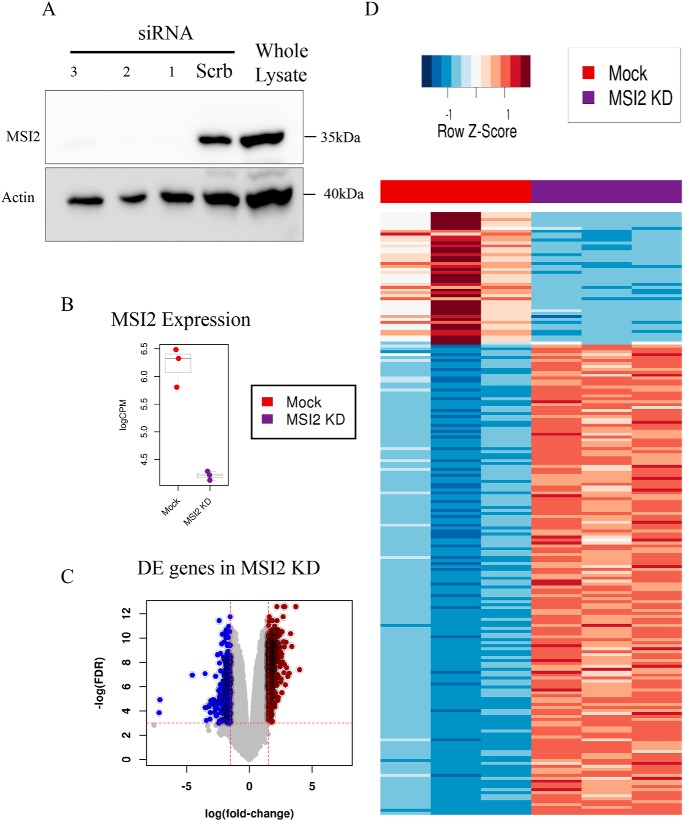
Figure 2.
Targets bound and regulated by MSI2. A, Western blotting showing the down-regulation of MSI2 after siRNA knockdown. Antibodies are indicated. Beta-actin was used as loading control and molecular size markers are indicated. B, expression changes of MSI2 in MSI2 KD (logFC = −2.02; FDR = 2.59E-29) measured by RNA-Seq data. C, volcano plots showing transcriptome-wide differences in RNA-Seq expression data upon MSI2 knockdown, with a logFC threshold set to −1.5/1.5 and FDR threshold set to 0.05 (red dotted lines). D, heat map representing the relative difference in the expression of genes between mock and MSI2 knockdown samples.

