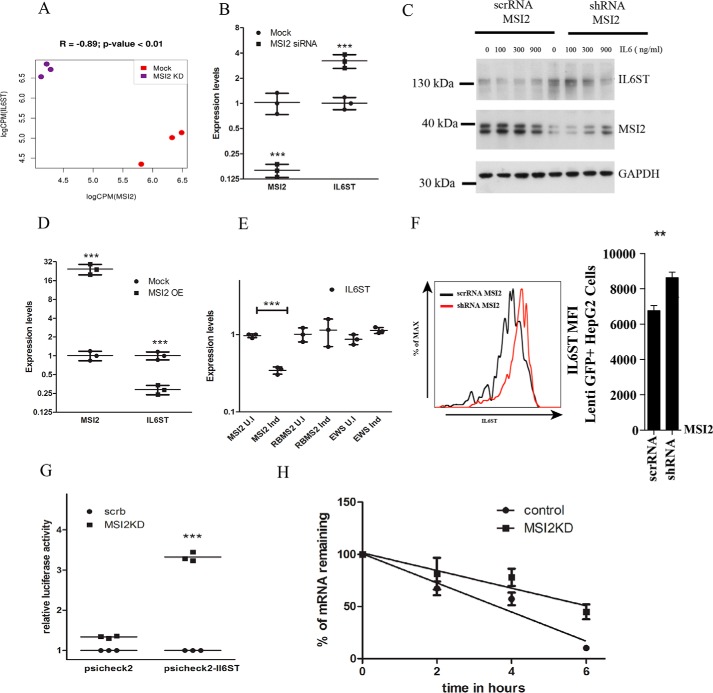
Figure 3.
MSI2 regulates IL6ST transcript levels. A, expression correlation measured by RNA-Seq between IL6ST and MSI2 in Mock and MSI2 KD samples. B, quantitative real-time PCR of differential gene regulation of IL6ST upon MSI2 siRNA–treated cells and untreated cells. qPCR data were analyzed using two-way ANOVA and presented as mean ± S.D. (***, p < 0.001; n = 3 biological replicates). Data were normalized to actin levels. C, Western blotting showing the protein levels of IL6ST, MSI2, and GAPDH in cells stably expressing MSI2 shRNA and scrambled RNA upon IL-6 treatment. Concentration of IL-6 and antibodies are indicated. Molecular size markers are indicated. D, qPCR of relative mRNA levels of IL6ST in cells expressing MSI2 stably and HEK293T cells as control. Data were analyzed using two-way ANOVA and presented as mean ± S.D. (***, p < 0.001; n = 3 biological replicates). Data were normalized to actin levels. E, qPCR of relative mRNA levels of IL6ST in induced and uninduced cells where MSI2, RBMS2, and EWSR1 are under inducible tetracycline promoter. Data were analyzed using two-way ANOVA and presented as mean ± S.D. (***, p < 0.001; n = 3 biological replicates). Data were normalized to actin levels. F, to the left is flow cytometric analysis of IL6ST surface expression on Lenti GFP+ Hep G2 cells which were stably transfected with scrambled and MSI2 shRNA. The same is represented as bar diagram on the right side. Data were analyzed with the Student's t test and presented as mean ± S.D. (**, p < 0.01; n = 3 biological replicates). G, MSI2 silencing increased the reporter activity in cells treated with psiCHECK2-IL6ST compared with those treated with vector control (psiCHECK2). Data are shown as the -fold increase in luciferase activity (RLU). Data were analyzed with the Student's t test and presented as the mean ± S.D. (***, p < 0.001; n = 3 biological replicates). H, IL6ST mRNA transcript levels in cells treated with scrambled or MSI2 siRNAs followed by actinomycin D treatment were plotted against time after actinomycin D addition and fitted to a linear regression model. Data were analyzed with the Student's t test and the data points are presented as the mean ± S.E. The solid line represents the fitted line through the data points. Experiment was carried out in biological triplicates.

