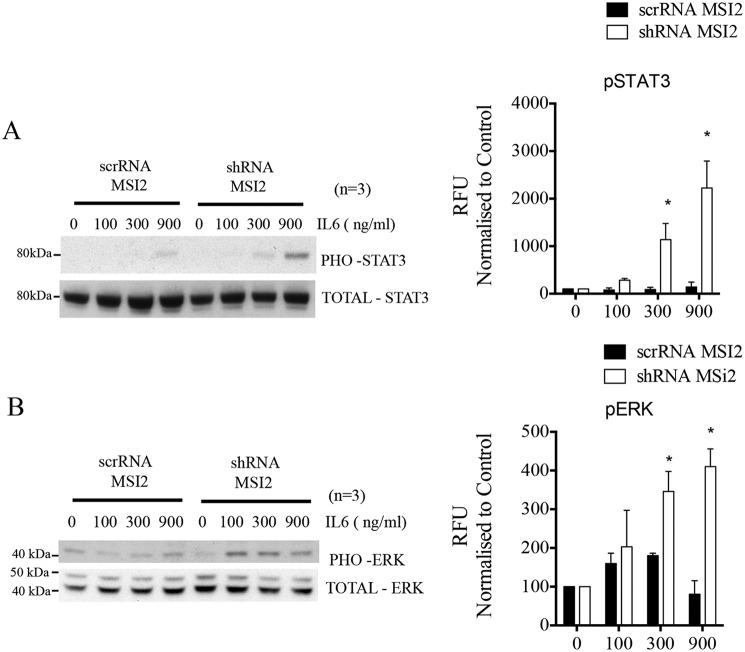
Figure 4.
MSI2 effects phosphorylation of STAT3 and ERK. A, Western blotting showing the protein levels of phosphorylated STAT3 and total STAT3 in cells stably expressing scrambled (control) and MSI2 shRNA upon IL-6 treatment. Antibodies and concentration of IL-6 are indicated. On the right is the densitometric quantification of phosphorylated STAT3 protein band, which is normalized to total STAT3 protein from three independent blots. Data were analyzed with the Student's t test and presented as the mean with S.D. (*, p < 0.05; n = 3 independent blots). B, Western blotting showing the protein levels of phosphorylated ERK and total ERK in cells stably expressing scrambled (control) and MSI2 shRNA upon IL-6 treatment. Antibodies and concentration of IL-6 are indicated. On the right is the densitometric quantification of phosphorylated ERK protein band normalized to total ERK protein from three independent blots. Data were analyzed with the Student's t test and presented as the mean with S.D. (*, p < 0.05; n = 3 independent blots).

