Figure 1.
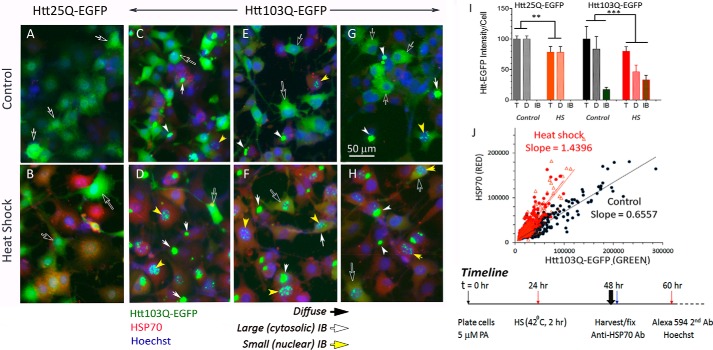
Heat shock drives the remodeling of diffusible assemblies of mHtt to form IBs in a PC12-derived neuronal cell line. The 25Q cHtt and 103Q mHtt PC12 cells were plated in 96-well plate. PA was added to a final concentration of 5 μm at plating (t = 0) to induce cHtt and mHtt expression. The time line of this experiment is as indicated in the bottom right of the figure. Briefly, heat shock (HS) was at the 24-h time point by placing designated wells/strips of cells in a 42 °C incubator for 2 h and then returned to 37 °C incubator. Cells were harvested and fixed at 48 h. To track the expression of HSP70 as a response to heat shock, we used a rabbit polyclonal antibody against HSP70 followed by Alexa Fluor 594–labeled goat anti-rabbit IgG secondary antibody. Nuclei were stained with Hoechst 33342. Cells were imaged with EVOS® FL microscope with a 10× objective; all images of a given experiment were captured at the identical settings of exposure time and light intensity/contrast. A–H, cropped and contrasted areas of representative images of the 25QHtt and 103QHtt cells under control and heat shock conditions as indicated. Each of the image frames represents an area of ∼200 × 266 μm. Black arrows point to diffuse Htt–EGFP signal; white arrows point to IB; yellow arrows point to punctate nuclear IB. No IB was detected in the Htt25Q PC12 cells. I, mHtt quantitation. Averaged intensities per unit cell of total, diffuse, and IB Htt–EGFP of images from five independent experiments were done over a 2-year period with 25 independent cell samples per condition. Results shown here are relative to that of the control total of 100%. J, scatter plot of the HSP70 (red) versus Htt103Q–EGFP (green) signal of control versus HS cells. Individual cells of representative images of control (black symbol) and heat shock cells (red symbol; the two red lines represent results of two separate images) were marked as region of interest (ROI). The red (HSP70) and green (mHtt) signals of each ROI were determined by ImageJ and displayed as scatter plots. Probability of difference p >0.05 is defined as not significant, between 0.01 and 0.05 is significant (*), <0.01 is very significant (**), and <0.001 is extremely significant (***). A–H, full-frame original images are included in Fig. S1, A–H. Error bars represent S.D.

