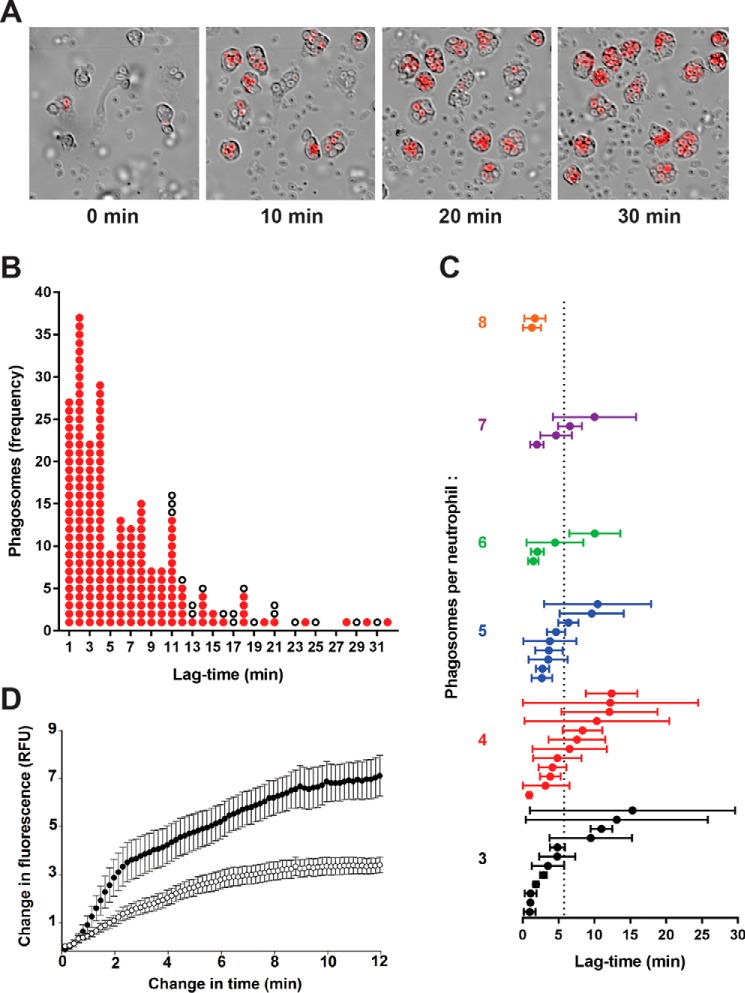
Figure 8.
HOCl production in individual phagosomes of neutrophils stimulated with opsonized zymosan as assessed by live-cell fluorescence imaging. A, time-lapse frames at 0, 10, 20, and 30 min from a movie of neutrophils and R19-S incubated with zymosan particles (1:20). Images show merged Cy3/DIC channels, and the full video is available in Movie S1. B, analysis of 233 phagosomes from 54 neutrophils monitored in a typical experiment as in A. The change in time is the interval between frames when phagocytosis of a particle occurred and R19 fluorescence first appeared. Each phagosome is plotted as a red dot against the time it took to start fluorescing. White dots represent phagosomes that formed in the first 20 min of the movie, but failed to fluoresce within the plotted time change until the end of the video. C, mean lag-times for fluorescence in neutrophils with three or more phagosomes. Each plotted circle represents one of 43 monitored neutrophils, where the mean lag-time ± S.D. was calculated for the initial appearance of detectable fluorescence in its phagosomes after ingestion of a zymosan particle. The neutrophils are arranged vertically in increasing order of how many phagosomes were monitored per neutrophil. The mean lag-time across all 197 fluorescent phagosomes was 5.8 min, indicated by the dotted line. D, the development of fluorescence in phagosomes was compared for neutrophils incubated with zymosan in the absence (●) or presence (○) of MPO inhibitor TX1 (10 μm). The increase in fluorescence intensity is plotted against time, starting from when it was first detectable. Data points are the mean ± S.E. from 20 phagosomes analyzed in three separate experiments. A low fluorescence intensity was set and each video frame was analyzed until maximum fluorescence was obtained using Cell R software.

