


Figure 8.
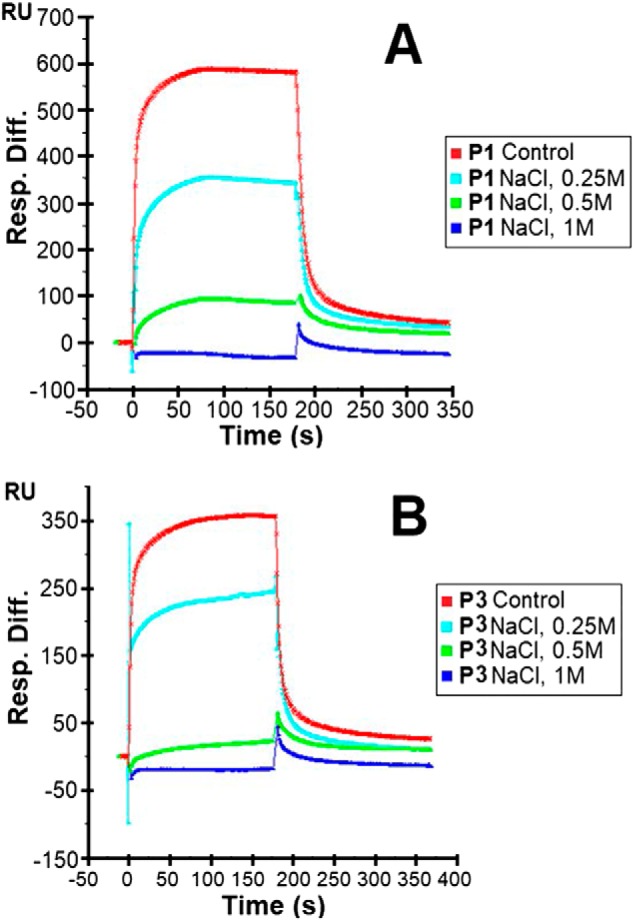
Sensorgrams of heparin–piscidin interactions under different salt concentrations. 5 μm P1 (A) and 5 μm P3 (B) were used under different concentrations of NaCl. The experiments were performed in triplicate, with one representative data set displayed here.