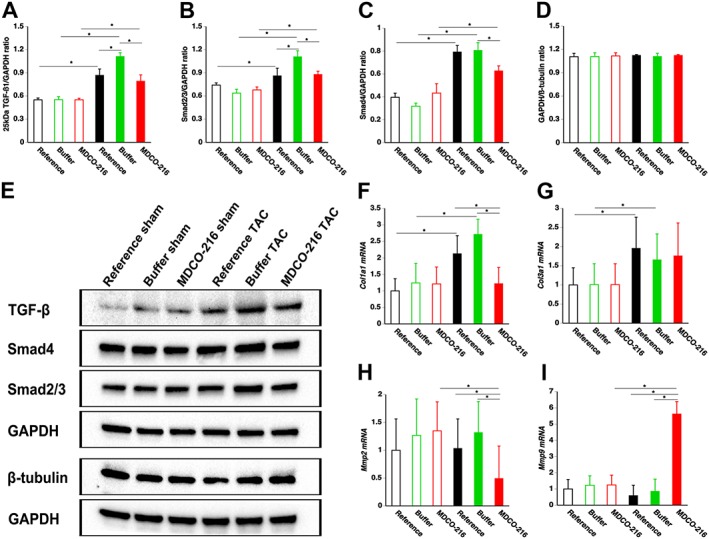
Figure 7.

MDCO‐216 infusion in TAC mice reduces TGF‐β1 signalling, increases Col1a1 expression and increases Mmp2 expression in the myocardium. Bar graphs illustrating the 25 kD isoform of TGF‐ß1 (A), Smad2/3 (B) and Smad4 (C) myocardial protein levels quantified by Western blot in the myocardium. Sham mice and TAC mice are indicated by open and closed bars respectively. All protein levels were normalized to the GAPDH protein level. The GAPDH/ß‐tubulin ratio is shown in panel (D). Representative images of Western blots are shown in panel (E). All data represent means ± SEM (n = 8). *P < 0.05. Bar graphs showing normalized Col1a1, Col3a1, Mmp2 and Mmp9 mRNA levels quantified by RT‐qPCR in the myocardium. Data are expressed as geometric means ± geometric SE (n = 8). *P < 0.05.
