
Figure 3.
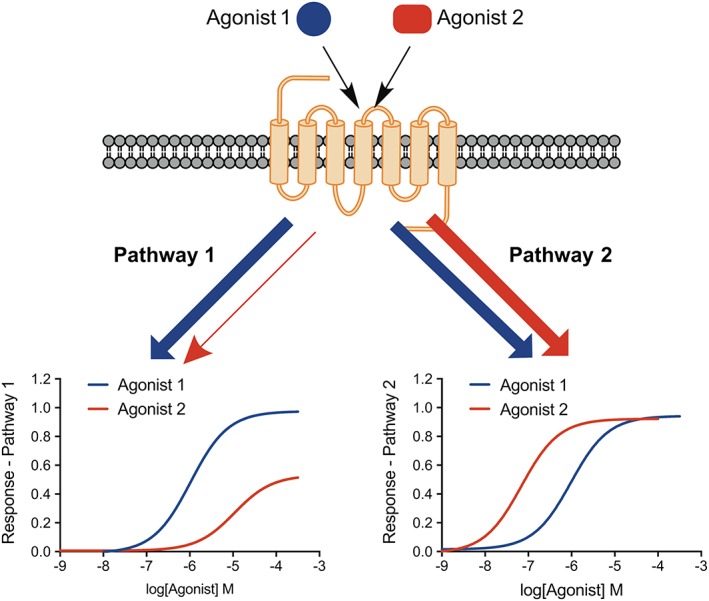
Schematic representation of biased agonism. Relative to Agonist 1 (blue), Agonist 2 (red) is biased towards stimulation of Pathway 2 over Pathway 1. The relative bias of Agonist 2 is shown by the reversal in potency between the two pathways.