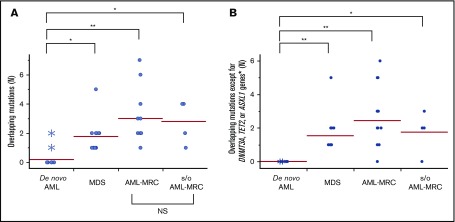
Figure 5.
Overlapping mutations are significantly enriched in MDS and AML-MRC. Each dot represents the number of overlapping mutations (A) and overlapping mutations except for DNMT3A, TET2, and ASXL1 (B) in each patient. Asterisks indicate the number of mutations detected in NPM1-AML. *P < .05, **P < .01. NS, not significant.

