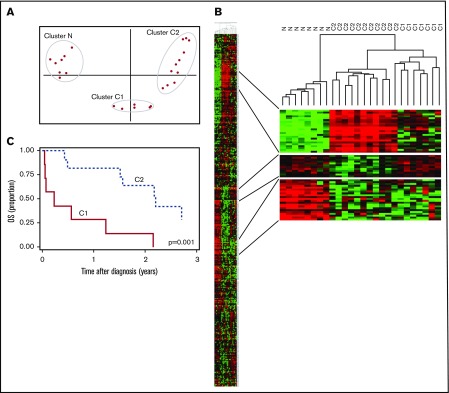
Figure 2.
PCA cluster analysis. (A) PCA analysis showing distinct separation of PTCL-NOS tumors from nonneoplastic lymphoid reference tissue and additional clustering within PTCL-NOS in distinct groups (ie, C1 and C2). (B) Hierachical clustering showing distinct protein profiles between N, C1, and C2. With this analysis, 1 of the C2 patients clustered with the C1 group. Green denotes downregulation, and red denotes upregulation. (C) OS of PTCL-NOS patients according to groups (C1 and C2) identified from cluster analysis. N, nonneoplastic lymphoid tissue.

