Figure 1.

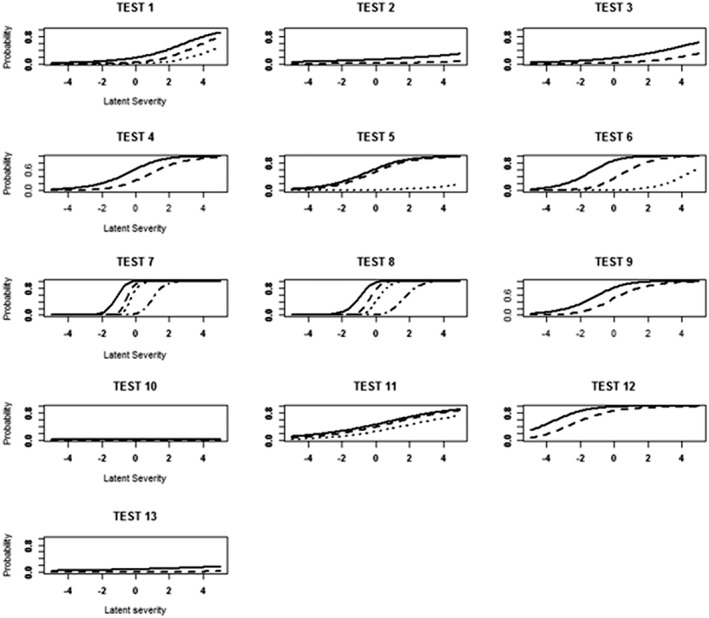
Item characteristic curves estimated for each test. The x‐axis shows severity, and the y‐axis the predicted probability of getting a score greater than 1 (solid line), 2 (dashed line), 3 (dotted line) and 4 (dot–dash line), respectively

Item characteristic curves estimated for each test. The x‐axis shows severity, and the y‐axis the predicted probability of getting a score greater than 1 (solid line), 2 (dashed line), 3 (dotted line) and 4 (dot–dash line), respectively