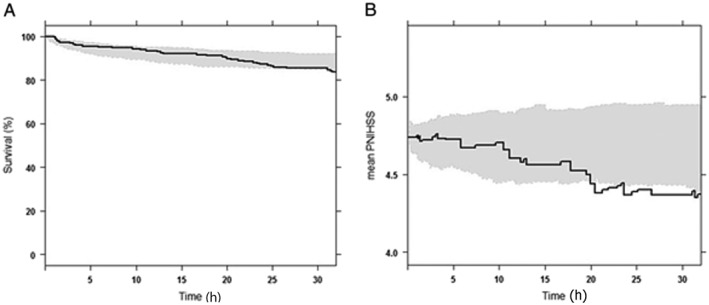
Figure 5.

Visual predictive check for time‐to‐event (TTE) model for haemorrhagic transformation obtained using Weibull hazard (A) and the associated Kaplan–Meier mean covariate plot for predicted NIHSS score (B). Survival curve in (A) denotes Kaplan–Meier survival probability, and PNIHSS in (B) denotes predicted National Institutes of Health Stroke Scale score. In both panels, shaded areas represent the 95% confidence interval of the predicted value
