
Figure 2.
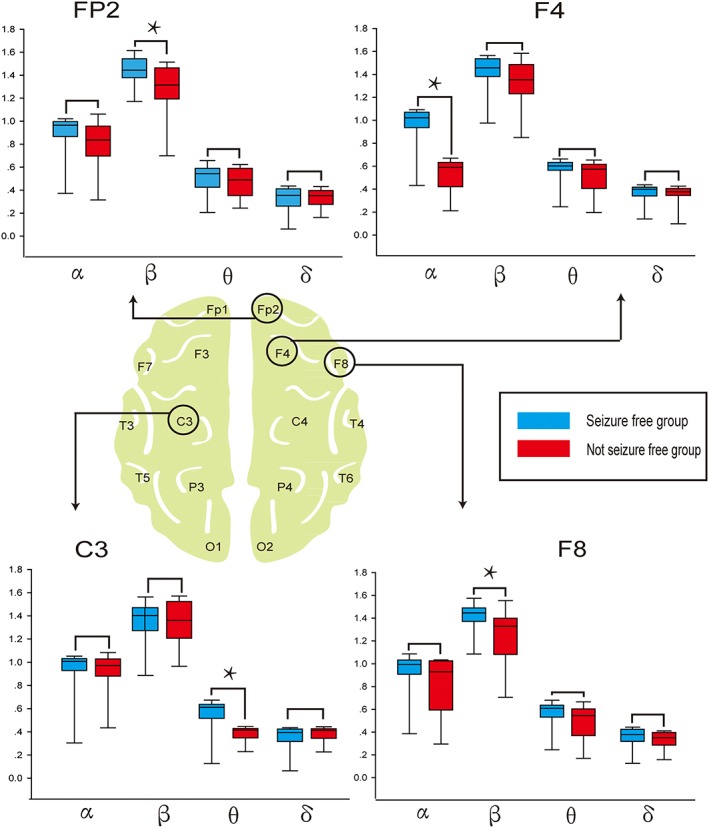
Sample entropy of the bands with a significant difference between seizure‐free (SF) and not seizure‐free (NSF) groups. Graphic presentation (box‐plot diagrams) of relative sample entropy within each frequency band in channels FP2, F4, C3, and F8, which are significantly different between the SF and NSF patients. The lower and upper borders of the rectangular box correspond to the 25% and 75% percentiles of the data, with the median indicated by the black line. The red box represents the SF group, and the blue box represents the NSF group. *indicate statistically significant results. Compared with SF patients, the NSF patients had significantly decreased Sample Entropy in the β frequency band of Fp2, α frequency band of F4, θ frequency band of C3, and β frequency band of F8 (Mann–Whitney U test, P < 0.05)