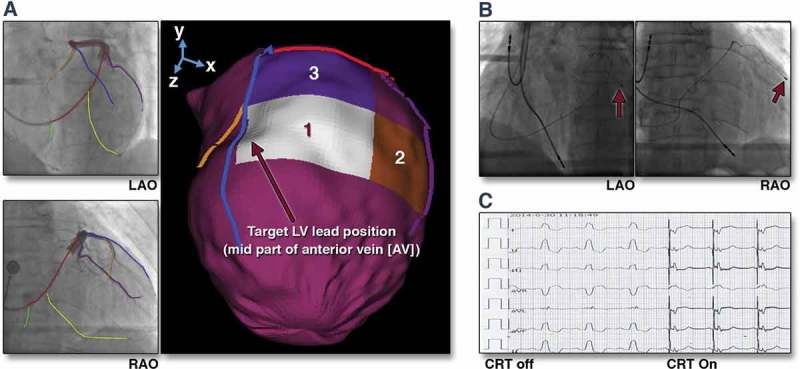
Figure 4.

(A) Target venous site for LV lead placement. Major LV veins were drawn on fluoroscopic venograms, reconstructed to a 3D structure, and fused with SPECT LV epicardial surface. The mid part of AV (blue line) was aligned with the optimal segment (white segment), and so was targeted for lead placement. (B) Post-implant fluoroscopy. The LV lead was placed using the guidance in (A). The post-implant images show that the LV lead (red arrows) was on target. (C) Post-implant electrocardiogram. The QRS duration decreased from 168 to 140 ms immediately after the cardiac resynchronization therapy (CRT) device was turned on. RAO 1⁄4 right anterior oblique. Reproduced with permission from Elsevier.
