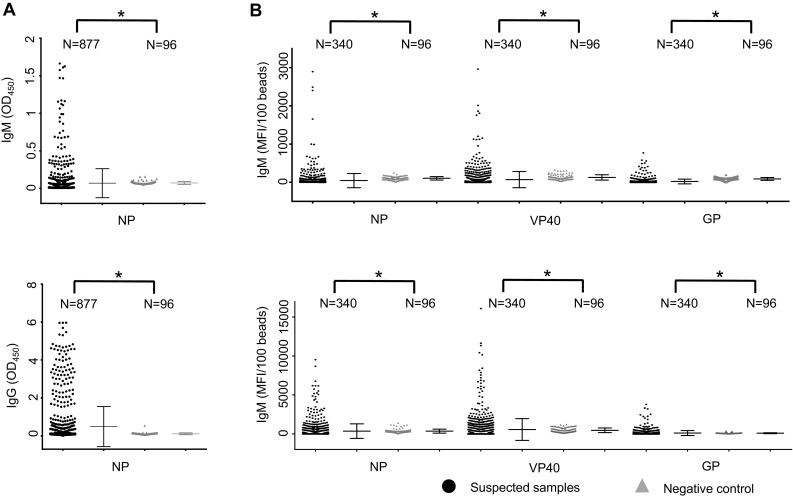
Fig. 2.

Evaluation of ELISA and Luminex results to detect Ebola virus (EBOV)-specific IgM/IgG. (A) In total, 877 specimens were assessed for EBOV-specific human IgM, using capture ELISA kit (upper) and IgG ELISA assays (lower). The Y-axis represents optical density (OD) values at 450 nm. (B) In total, 340 samples, selected randomly on the basis of RNA-negative samples, were detected using IgM and IgG Luminex assays for NP (left), VP40 (middle), and GP (right). The Y-axis represents the mean fluorescence intensity (MFI) values per 100 beads. Arithmetic mean and the standard deviation (STD) values are shown in each figure. Filled square represents specimens from suspected patients; Filled teiangle, health donors. Statistical comparisons between groups are analyzed using two-tailed unpaired t-tests with SPSS 23. A P-value less than 0.05 is considered statistically significant (P < 0.05 is represent as *)
