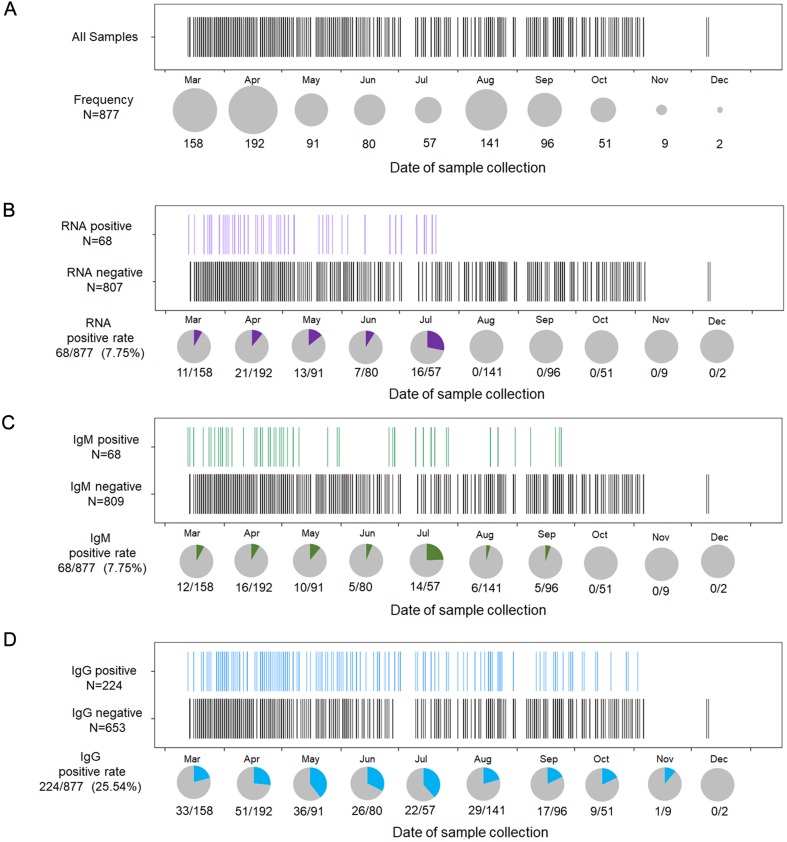
Fig. 3.
Temporal distribution of RNA and IgM/IgG antibodies in 877 specimens, detected from March to December 2015. (A) In total, 877 specimens are shown in accordance with the date of specimen collection (from March to December). One black bar represents one sample. Specimen frequency per month is denoted by the size of the grey pie charts. (B) In total, 877 specimens were assessed via RT-PCR to distinguish RNA-positive samples from RNA-negative samples. One purple bar represents one RNA-positive sample. Rates of positive RNA detection per month are denoted by the purple portions in the grey pie charts. (C) Specimens are assessed for the presence of IgM. One green bar represents one IgM-positive sample. Rate of positive IgM detection per month is denoted by the grey portion of the pie chart; green, IgM-positive samples. (D) Samples assessed for the presence of IgG. One blue bar represents one IgG-positive sample. Rate of positive IgG detection per month is denoted by the blue portion in the grey pie chart.

