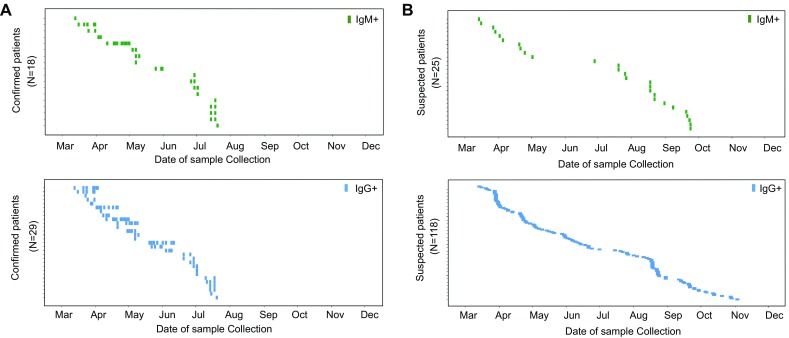
Fig. 4.

Temporal distribution of confirmed and suspected patients displaying positive detection rates for IgM/IgG from March to December 2015. (A) Confirmed patients with IgM positive (upper) and IgG positive (lower) samples are shown in accordance with the date of specimen collection. (B) Suspected patients with IgM-positive (upper) and IgG-positive (lower) samples. The Y-axis represents the confirmed patients (upper) with their designated patient numbers. Each lateral line represents one patient. One green block represents one IgM-positive sample; blue block, IgG-positive sample; a series of specimens from one patient are shown laterally.
