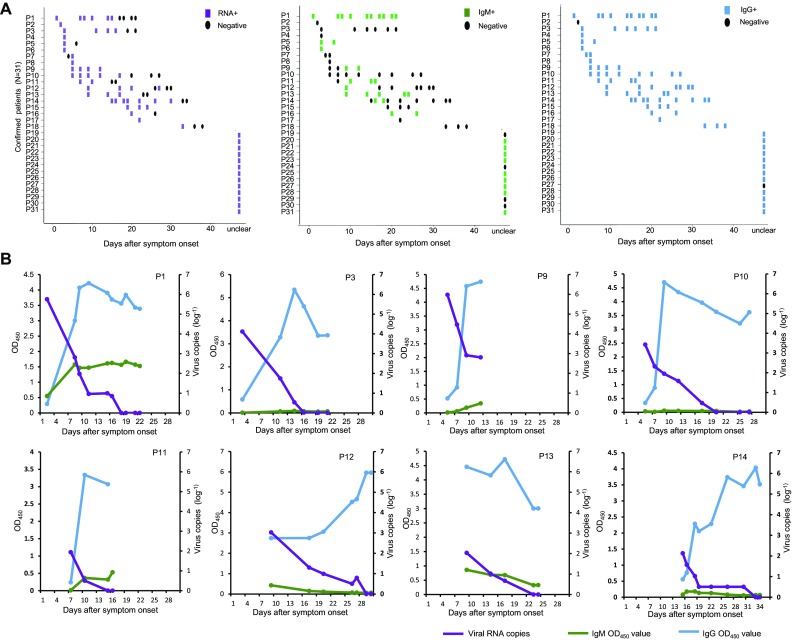
Fig. 5.

Dynamic changes in viremia and IgM/IgG responses in 31 confirmed patients with Ebola virus disease. (A) RNA detection and measurement of IgM and IgG titers were performed in accordance with the days of symptom onset. The Y-axis represents 31 confirmed patients. The X-axis represents days of symptom onset. Each lateral line represents one patient. One block represents one sample: purple, RNA detection results of one specimen (left); green, IgM (middle); blue, IgG (right). Black dots represent negative results. (B) Dynamic detection of Ebola viral load and IgM and IgG titers in confirmed patients. Eight patients with more than four longitudinal samples during their disease course were selected. The dynamic trends of Ebola-related viremia and IgM/IgG responses in each patient were further analyzed and shown in accordance with the days of symptom onset. Purple lines represent dynamic changes in viremia; green lines, IgM; blue lines, IgG. The X-axis represents days from disease onset; left-Y-axis represents mean OD450, right-Y-axis represents viral load (log–1).
