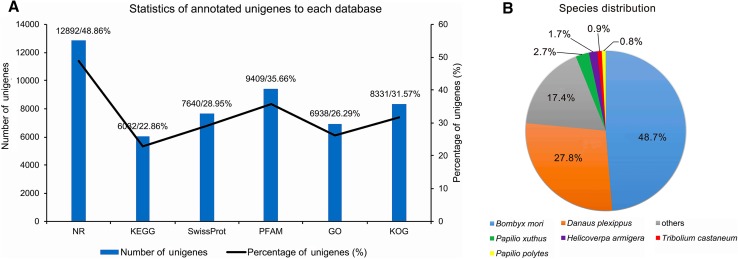
Fig. 4.
Annotation and species distribution details. A Statistics of annotated unigenes to each of six databases used for annotation; the number of unigenes annotated in each database is shown by the bar and their respective percentage by line graph (left and right Y-axis respectively). Number and percentage of unigenes annotated through each database are also listed on the top of each histogram separated by a slash (/). B Species distribution of the BLASTx results from the transcriptome annotations, numbers showed the similar percentage of genes to that species.

