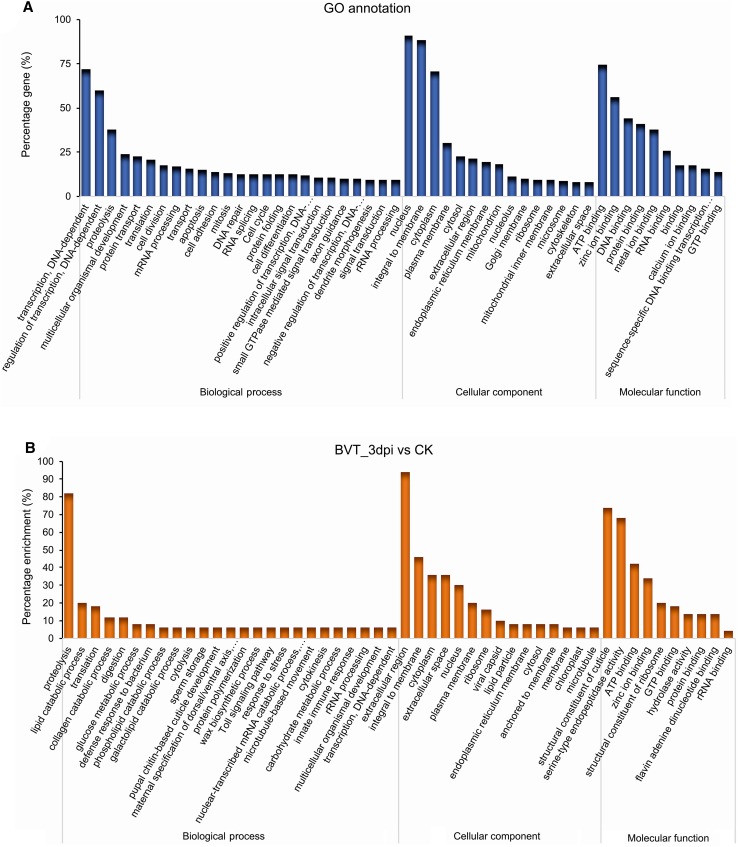
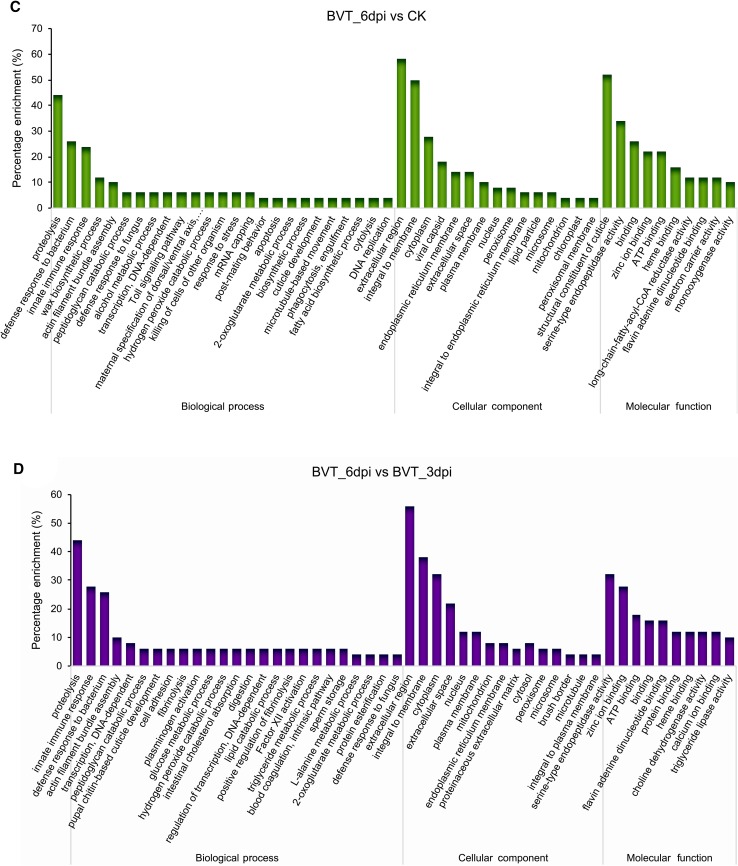
Fig. 5.
GO annotation and classification details. GO terms are summarized in three main categories of biological process, cellular component, and molecular function. The X-axis represents the percentage of genes involved in each term A GO annotation result of overall transcriptome classification B GO functional enrichment of DEGs between BVT_3dpi versus CK, C BVT_6dpi versus CK, D BVT_6dpi versus BVT_3dpi.


