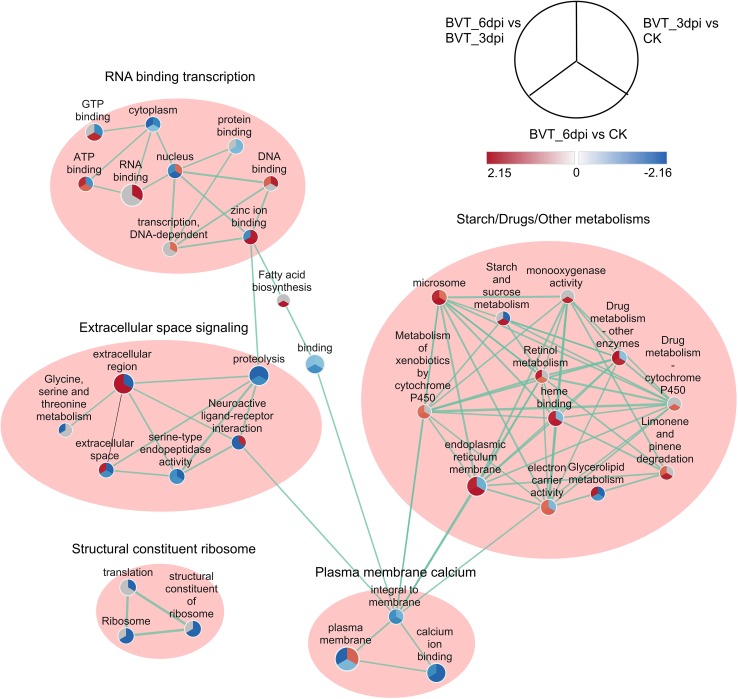
Fig. 7.
Enrichment Map representation of the ranked GSEA results obtained for comparative analysis between each permutation of CK, BVT_3dpi, and BVT_6dpi. Each node represents enriched GO/KEGG term and is divided into three parts representing each one to one comparison between samples as illustrated in legend their color and shading intensity represents the statistical significance of enrichment. The thickness of edges represents the richness of shared genes between connected nodes. Different clusters represent the biological meaning of involved pathways as depicted by Auto Annotate plugins of Cytoscape.

