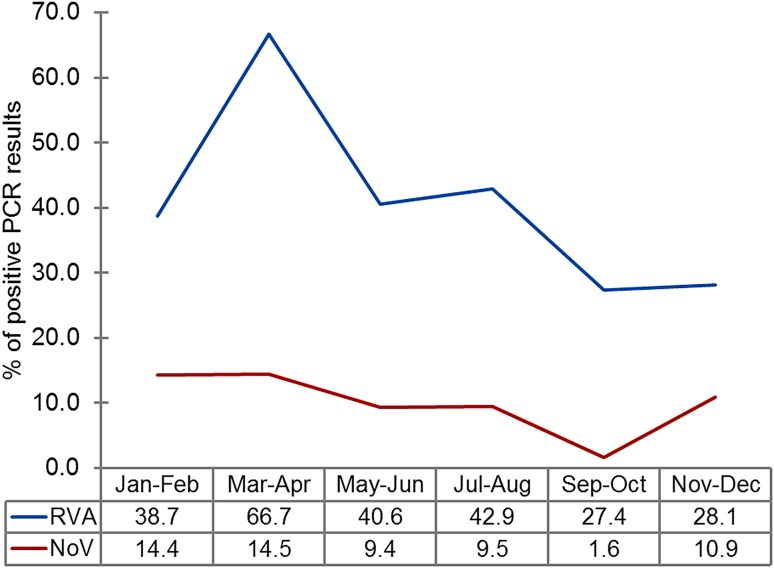
Fig. 2.
Distribution of rotavirus A and noroviruses detected in clinical samples according to month. The graph shows the change in the proportion of individuals positive for rotaviruses (RVA; blue line) and noroviruses (NoV; red line) during the year, determined by the percentage of samples with positive PCR results (n = 429).

