Fig. 3.
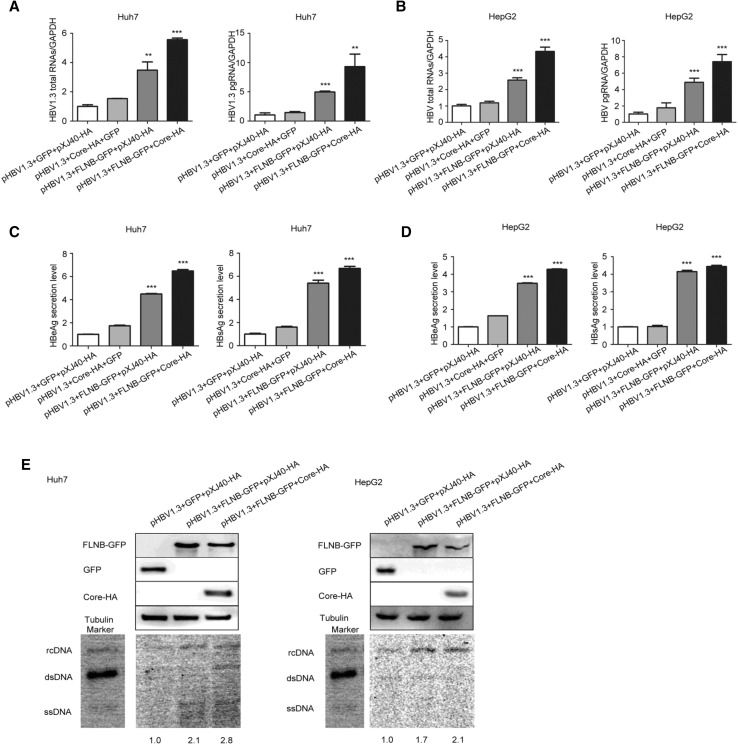
Interaction of filamin B and core protein promotes HBV replication. (A) Levels of HBV total RNAs and pgRNA in Huh7 cells were determined by real-time PCR. (B) HBV total RNAs and pgRNA levels in HepG2 cells were determined by real-time PCR. (C) Levels of HBeAg and HBsAg in culture medium supernatant of Huh7 cells were detected with ELISA. (D) Levels of HBeAg and HBsAg in culture medium supernatant of HepG2 cells were detected with ELISA. (E) HBV DNA was extracted at 96 h post-transfection and subjected to Southern blotting. Western blot showed that all proteins were overexpressed. Co-transfection with pHBV1.3, GFP and pXJ40-HA was used as a loading control. Ratios were quantified by gray analysis with GeneTools from Syngene software (GeneGnome5). HBV DNA marker bands are shown for relaxed circular DNA (rcDNA), double stranded DNA (dsDNA), and single stranded DNA (ssDNA). All results are shown as mean ± SD. (*P < 0.05, **P < 0.01, ***P < 0.001).

