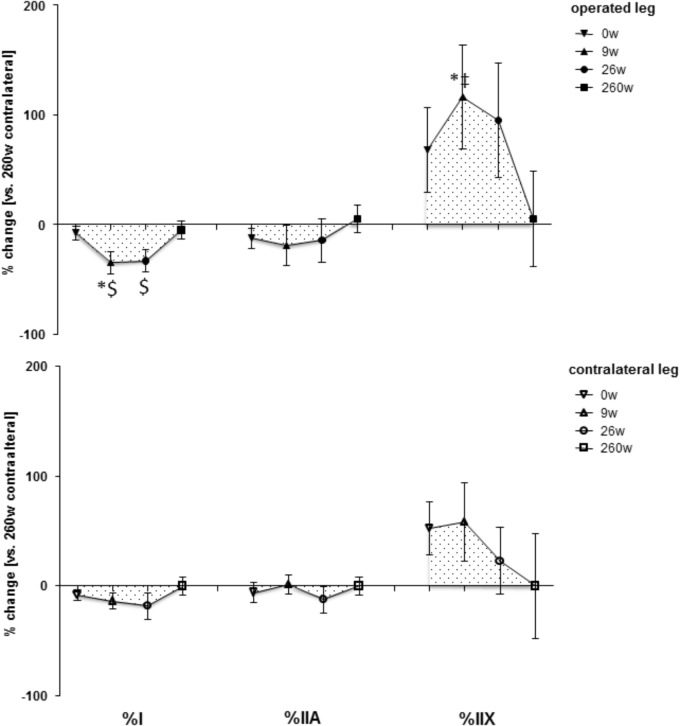
FIGURE 2.
Time line of adjustments in fiber type distribution. Line graph of mean ± SE of the differences in assessed volumetric parameters of muscle composition over time. Values are expressed respective to reference values at 260 weeks in the contralateral leg. For details see the list of abbreviations. $, p < 0.05 vs. 260 weeks contralateral leg; ∗, p < 0.05 vs. 0 week same leg; ‡, p < 0.05 vs. same time point contralateral leg. Repeated-measures ANOVA with post hoc test of Fisher (n = 9).

