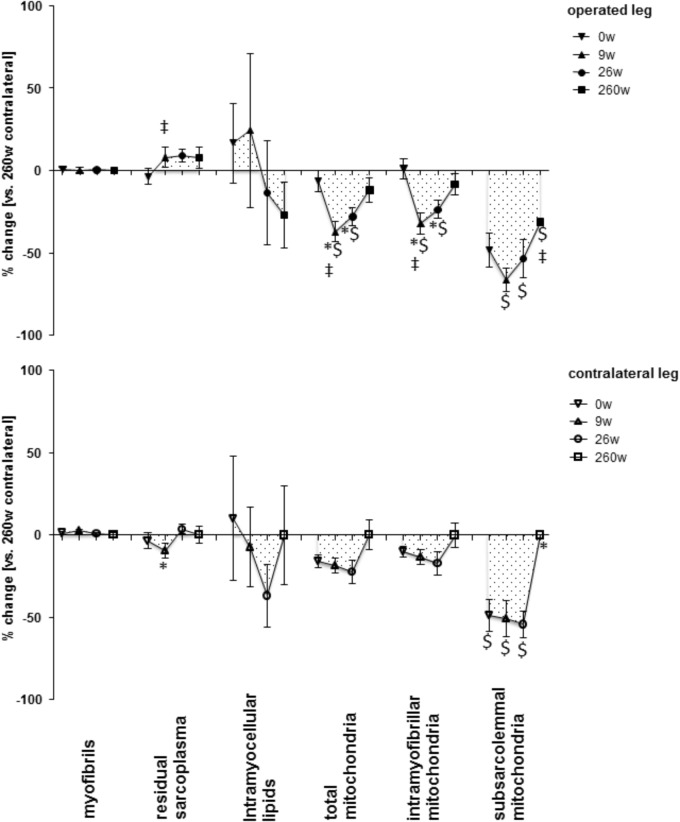
FIGURE 3.
Time line of alterations in muscle fiber composition in m. vastus lateralis. Line graph of mean ± SE of the differences in assessed volumetric densities of muscle ultra-structures. Values are expressed respective to reference values at 260 weeks in the contralateral leg. For details see the list of abbreviations. $, p < 0.05 vs. 260 weeks contralateral leg; ∗, p < 0.05 vs. 0 week same leg; ‡, p < 0.05 vs. same time point contralateral leg. Repeated-measures ANOVA with post hoc test of Fisher (n = 9).

