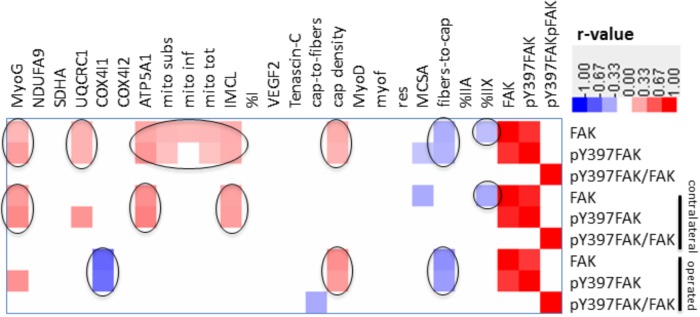
FIGURE 8.
Correlation matrix of relationships between FAK and muscle parameters. Heat map showing p-value weighed correlations between molecular and cellular parameters of m. vastus lateralis and FAK-related parameters for legs combined or separated. The color code used to visualize r-values is given. Only those relationships were shown which met a p-value ≤ 0.05. Relationships of interest are circled.

