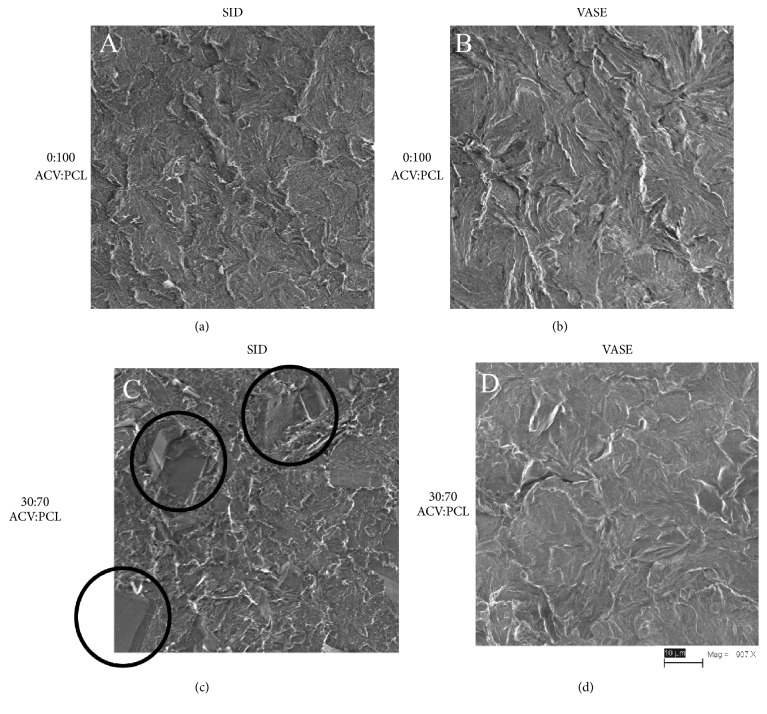
Figure 1.
Scanning electron micrographs of SID-treated v. VASE-treated rods, cross sections. Scale bar at bottom right shows 907x magnification and 10 μ length. (a) PCL alone, treated by the SID method. (b) PCL alone, treated by the VASE method. (c) 30:70 w:w ACV:PCL rod created by SID method; note black circles around large ACV crystals. (d) 30:70 w:w ACV:PCL rod created by VASE method; note absence of large ACV crystals.

