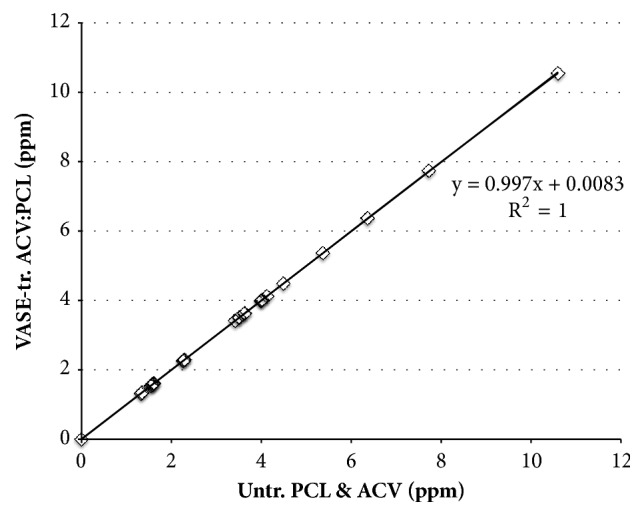
Figure 3.

Comparison of 1H NMR of untreated (Untr.) ACV and PCL v. VASE-treated (VASE-tr.) ACV:PCL. Untreated ACV and PCL were subjected to 1H NMR and the chemical shifts recorded (x-axis; see Table 2). A sample of 30:70 w:w ACV:PCL that was VASE treated was also subjected to 1H NMR (y-axis); chemical shifts are also available in Table 2. For each ordered pair, the ppm of an identified peak in untreated material was matched to the ppm of a corresponding peak from treated material. The slope of the calculated best-fit line shows that the untreated and treated materials have almost identical peaks, and the R2 value shows that the line fits with almost perfect precision.
