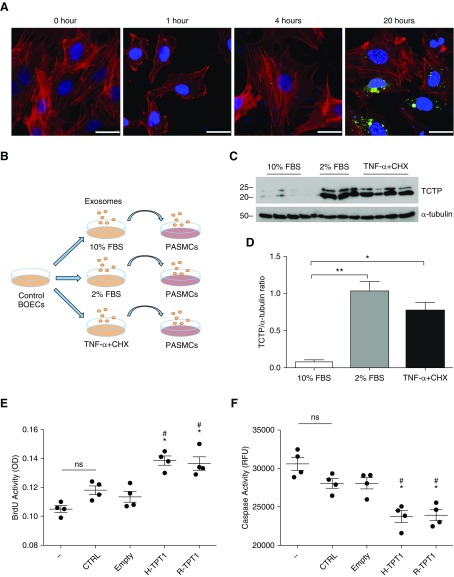
Figure 5.
PASMCs incorporate activated BOEC-derived exosomes, leading to an increase in TCTP expression. (A) PASMCs were incubated with exosomes labeled with PKH67 (green) for 1, 4, and 20 hours. Representative confocal images of PASMCs counterstained for F-actin (phalloidin; red) and DAPI (blue) are shown. Scale bars: 25 μm. (B) Experimental schematic. Briefly, exosomes were derived from control BOECs under the following conditions: basal conditions (10% exosome-free FBS plus growth factors for 24 hours [10% FBS]), activation conditions (2% exosome-free FBS for 24 hours [2% FBS]), and apoptosis/stress conditions (2% exosome-free FBS for 24 hours with TNF-α [3 ng/ml] and CHX [20 μg/ml] for the final 6 hours [2% FBS TNF-α + CHX]). PASMCs were then incubated with exosomes for 24 hours. (C) Representative immunoblot of TCTP expression in PASMCs incubated with exosomes from the above treatments. Blots were reprobed with α-tubulin to ensure equal loading. (D) Densitometry of TCTP expression levels relative to α-tubulin (n = 4; Student’s t-test). *P < 0.05, **P < 0.005. Error bars represent mean ± SD. (E and F) Proliferation and apoptosis assessments of PASMCs exposed to conditioned media from human umbilical vein endothelial cells overexpressing TCTP after lentiviral transduction. EC-conditioned media were harvested from nontransduced cells (CTRL) or from cells transduced with an empty vector (Empty), human TCTP (H-TPT1), or rat Tctp (R-TPT1). PASMCs were then exposed to fresh media (−) or conditioned media from serum-starved ECs (EC-CM) for 4 hours. (E) For proliferation, bromodeoxyuridine (BrdU) incorporation was assessed. (F) For apoptosis, caspase activity was measured. One-way ANOVA; #P < 0.001 versus CTRL; *P < 0.001 versus Empty. Error bars represent mean ± SEM. ns = not significant; OD = optical density; RFU = relative fluorescence units.

