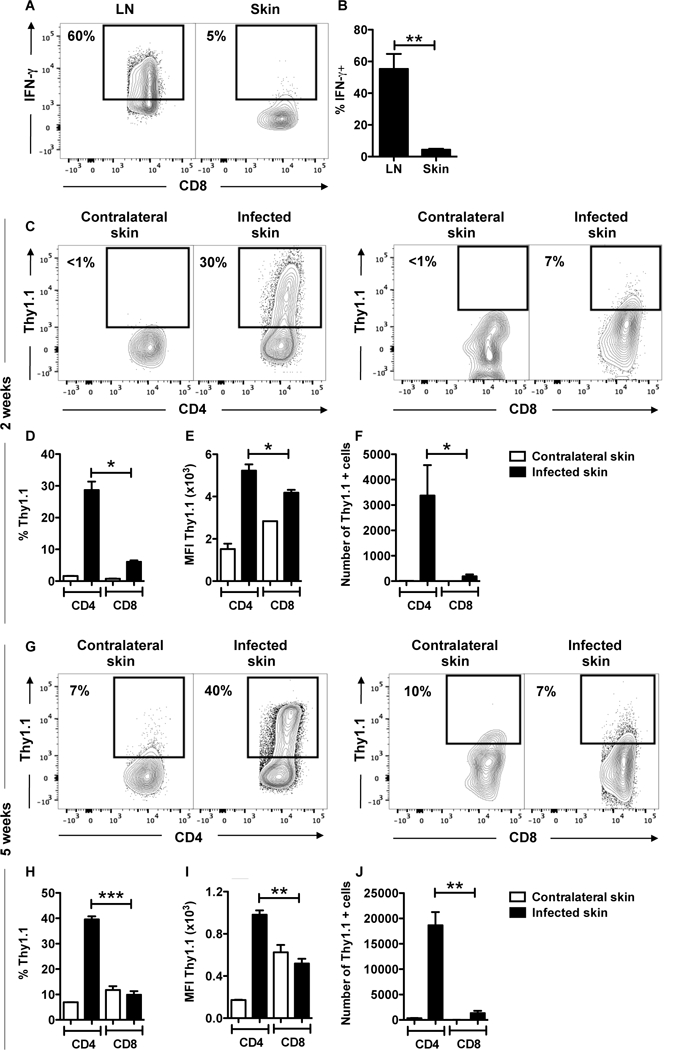
Figure 1:

CD8+ T cells do not produce IFN-g in the skin in response to L. major. (A, B) C57BL/6 mice were infected in the skin with 106 L. major and 5 weeks post infection mice were euthanized. The expression of intracellular IFN-g in CD8+ T cells was measured by flow cytometry in the draining LNs (LN) and infected ears. Depicted are (A) representative contour plots and bar graphs showing (B) percentage of IFN-g expressing CD8+ T cells in the draining lymph nodes (LN) and infected skin. (C-J) IFN-g reporter (Thy1.1) mice were infected in the skin with 106 L. major and 2 (C-F) or 4 (G-J) weeks post infection mice were euthanized. The expression of Thy1.1 directly ex vivo in CD4+ and CD8+ T cells was measured by flow cytometry in contralateral and infected ears. Depicted are (C, G) representative contour plots and bar graphs showing (D, H) percentage, (E, I) mean fluorescence intensity (MFI) and (F, J) number of Thy 1.1 expressing CD4+ and CD8+ T cells. Flow plots pregated on live/singlets/CD3/CD8b or CD4. Representative data from 3 or more independent experiments (n = 3 – 5 mice per group) are presented. *p ≤ 0.05, **p ≤ 0.01 or *** p≤ 0.001
