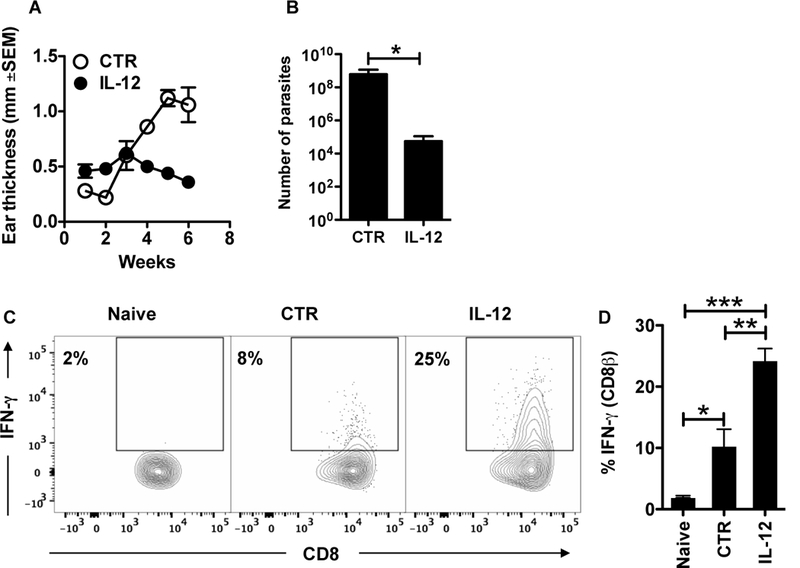
Figure 5:

IL-12 treatment enhances IFN-g production by CD8+ T cells in the skin. BALB/c mice were infected in the skin with 105 L. braziliensis in conjunction with a control (CTR) or IL-12 plasmid; (A) ear thickness was assessed weekly. Six weeks post infection mice were euthanized and the (B) number of parasites was determined in the skin and lesions were digested and used for flow cytometric analysis of intracellular IFN-g. Depicted are (C) representative contour plots and (D) bar graph of IFN-g intracelullar staining. Flow plots pregated on live/singlets/CD3/CD8b.Data from one experiment (n = 5 mice per group). *p ≤ 0.05, **p ≤ 0.01 or ***p ≤ 0.001
