Figure 6:

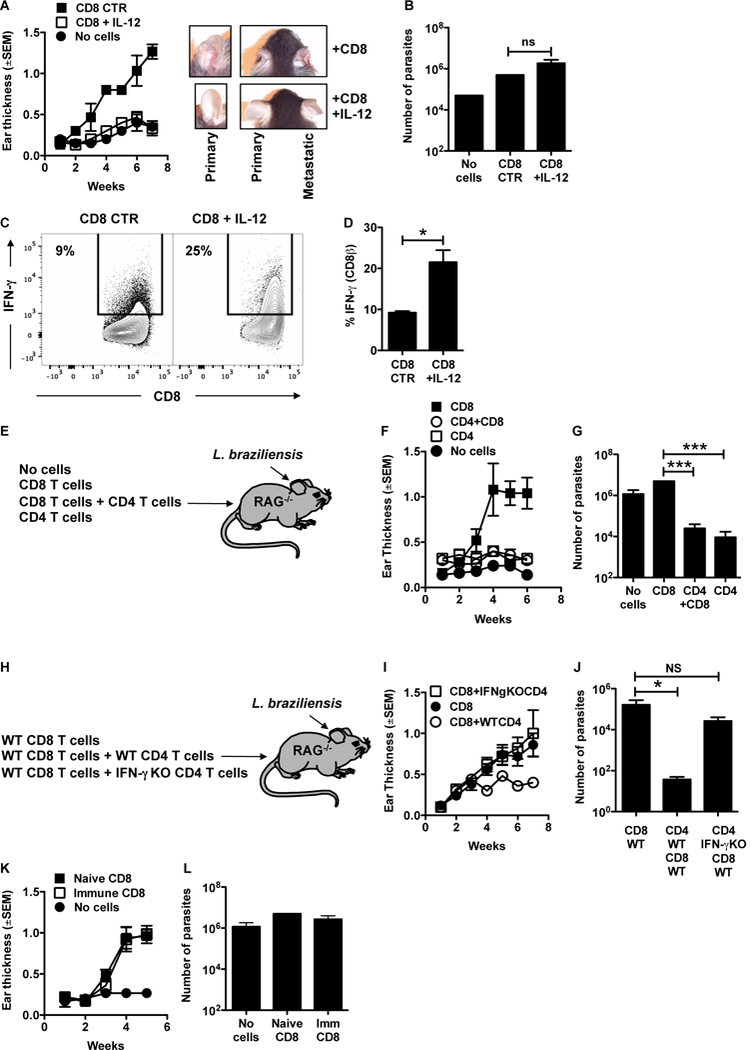
CD8+ T cells are unable to control leishmania infection. (A-D) RAG−/− mice were infected with L. braziliensis and reconstituted with CD8+ T cells or did not receive cells. At days 0 through 9 mice were treated with 0.5 mg/mouse of IL-12 i.p.; (A) course of infection and (B) number of parasites assessed in the skin at 7 weeks post infection. (C) Representative contour plots and (D) bar graphs of IFN-g expression in CD8+ T cells from the skin. Representative data from 4 independent experiments (n = 3 to 5 mice per group) with similar results are presented. Flow plots pregated on live/singlets/CD3/CD8b. (E) RAG−/− mice were infected with L. braziliensis and reconstituted with CD8+ T cells, CD4+ T cells or CD8+ and CD4+ T cells or did not receive cells. (F) Course of infection and (G) number of parasites assessed in the skin at 7 weeks post infection. Representative data from 2 independent experiments (n = 5 mice per group) with similar results are presented. (H) RAG−/− mice were infected with L. braziliensis and reconstituted with WT CD8+ T cells, WT CD8+ and WT CD4+ T cells or WT CD8+ and IFN-g KO CD4+ T cells or did not receive cells. (I) Course of infection and (J) number of parasites assessed in the skin at 7 weeks post infection. (K,L) C57BL/6 mice naive or infected with L. braziliensis for 10–15 weeks were euthanized and splenocytes were used as donors of CD8+ T cells. RAG−/− mice were infected with L. braziliensis and reconstituted with immune or naive CD8+ T cells or did not receive cells and (K) course of infection and (L) number of parasites assessed in the skin at 7 weeks post infection. Representative data from 3 independent experiments for the course of infection with similar results are presented; and one for the parasite titration (n = 5 mice per group) *p ≤ 0.05 or ***p ≤ 0.001; ns, non-significant
