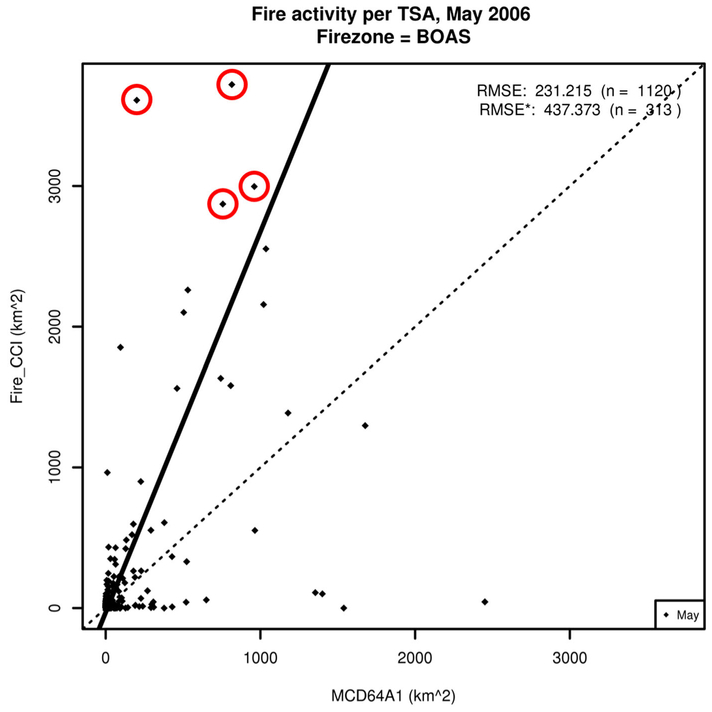
Figure 8.
Scatterplot for BOAS in May, 2006 illustrating burned area detected per TSA polygon for Fire CCI and MCD64A1. The four circled points represent the largest difference in burned area detected between Fire CCI and MCD64A1 and coincide with the burning events described in Chuvieco et al. (2016).

