Fig. 1.

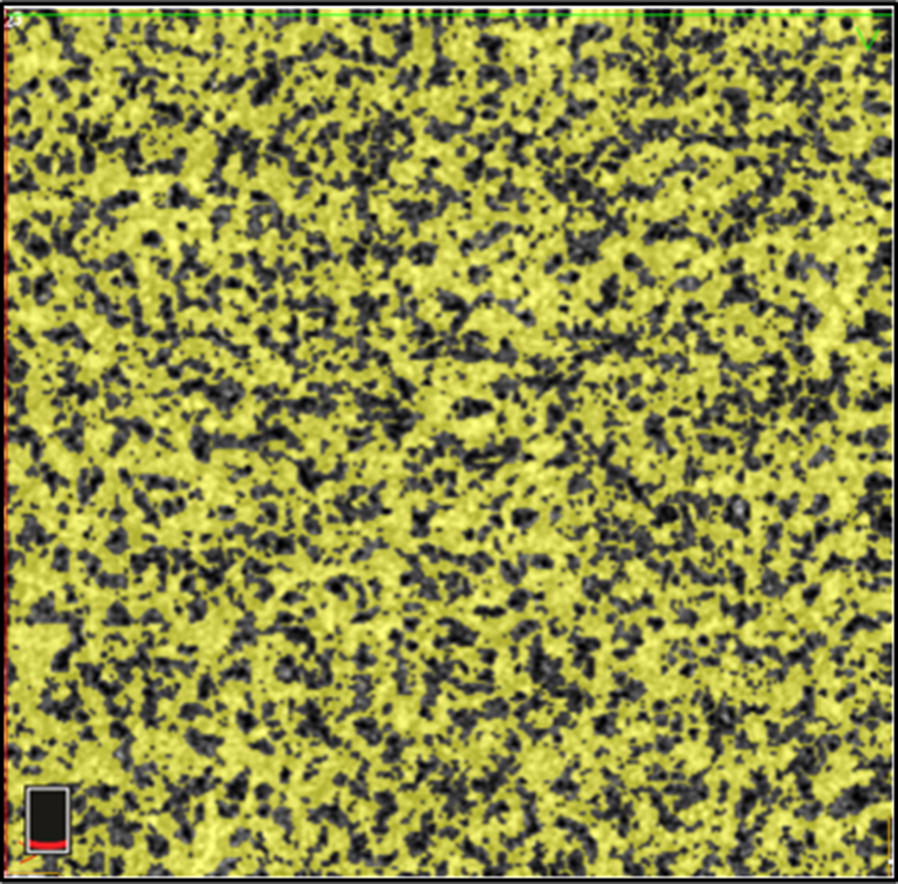
OCTA at the level of the choriocapillaris demonstrates vascular flow in the foveal region of a subject with no known ocular pathology. The yellow area depicts flow of the RBCs within the choriocapillaris

OCTA at the level of the choriocapillaris demonstrates vascular flow in the foveal region of a subject with no known ocular pathology. The yellow area depicts flow of the RBCs within the choriocapillaris