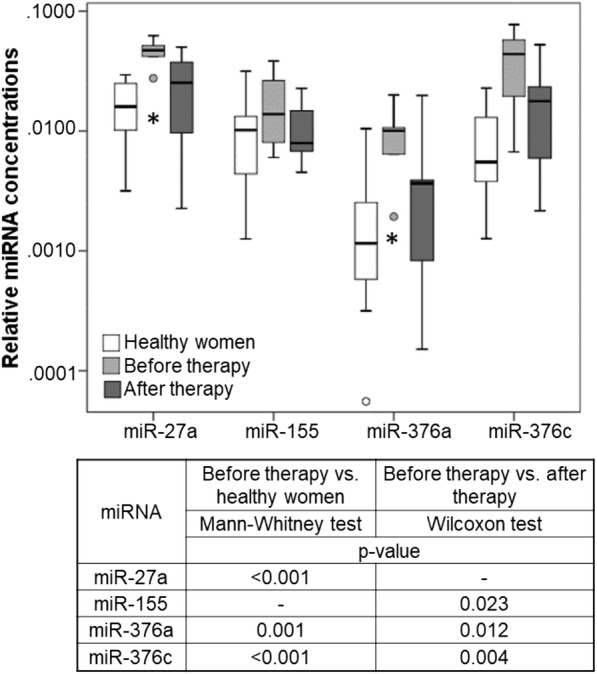
Fig. 4.

Exosomal miRNA levels before and after neoadjuvant therapy. The box blot shows the plasma levels of exosomal miRNAs of 9 BC patients before and after neoadjuvant therapy and 20 healthy women. p values comparing the expression levels before and after therapy, and between patients and healthy women are indicated in the table below the blot. Cells filled with “-” denote insignificant correlations
