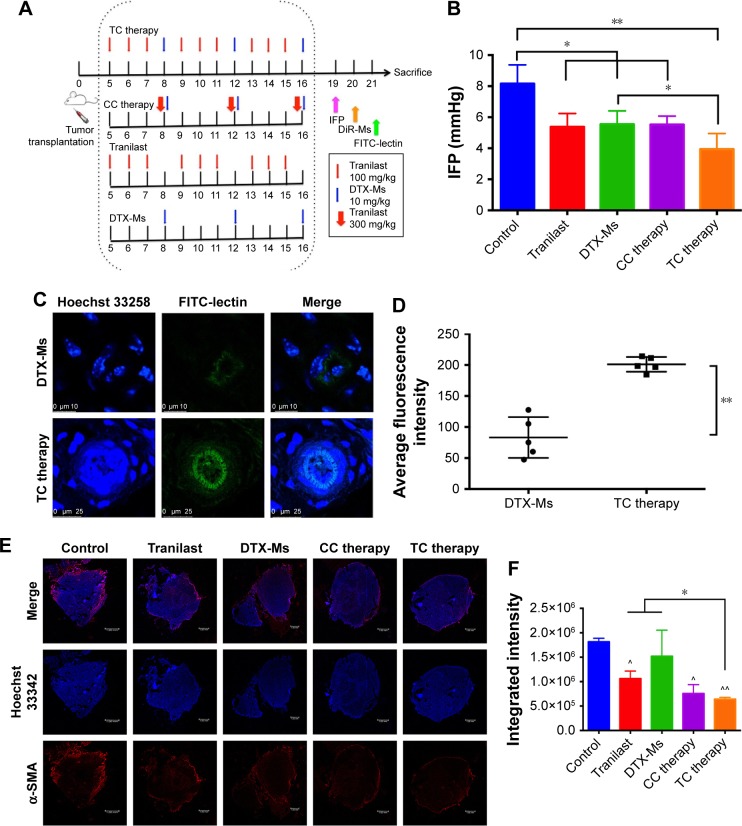
Figure 5.
Effect of treatments on tumor microenvironment.
Notes: (A) Treatment scenarios on tumor bearing mice. (B) IFP of 4T1 tumor bearing mice after treatments (n=3). (C) FITC-lectin perfusion in tumor. Scale bar: 10 µm (up); 25 µm (down). (D) Fluorescence intensity analysis (n=5). (E) CAFs marker α-SMA protein expression in tumor (scale bar: 1.00 mm). Red fluorescence indicated α-SMA protein and blue fluorescence indicated cell nucleus. (F) Fluorescence intensity analysis from sections of two mice. ^ and ^^ means significance to control. * means significance between tranilast (or DTX-Ms) and TC therapy. **P<0.01. *P<0.05.
Abbreviations: IFP, interstitial fluid pressure; CAFs, cancer-associated fibroblasts; α-SMA, α-smooth muscle actin; TC therapy, two-stage combination therapy; CC therapy, co-dose combination therapy; DTX-Ms, docetaxel micelles; DiR-Ms, 1,1′-dioctadecyl-3,3,3′,3′-tetramethylindotricarbocyanine iodide-loaded micelles.

