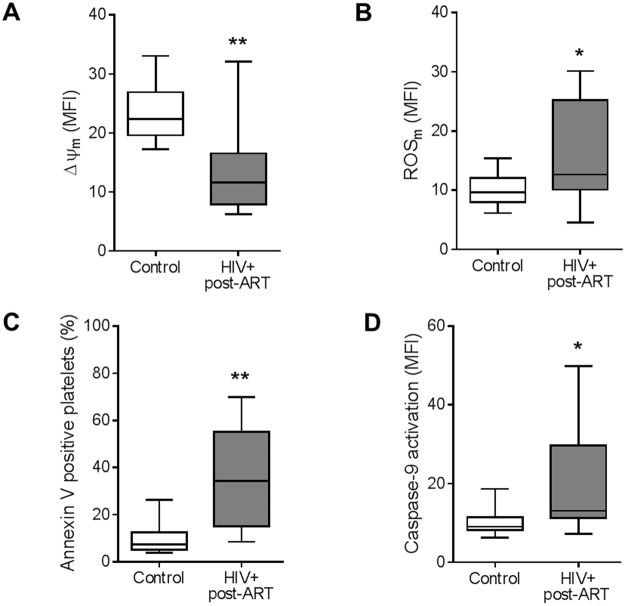
Figure 2.
Mitochondrial dysfunction and apoptosis in platelets from HIV-infected individuals under stable cART. (A) The mean fluorescence intensity (MFI) for TMRE indicating the mitochondrial membrane potential (∆ψm), (B) the MFI for MitoSoxRed indicating mitochondrial generation of reactive oxygen species (ROSm), (C) the percentage of platelets that bind annexin V, and (D) the MFI for the probe FLICA indicating caspase-9 activation were assessed in platelets freshly-isolated from healthy volunteers (control) or from HIV-infected individuals under viral control (HIV-1 viral load < 50 copies/ml in the peripheral blood). Box plots: The horizontal lines on the box plots represent the median, boxes limits indicate interquartile ranges and the whiskers indicate 5–95 percentile. The asterisk (*) signify p < 0.05 compared to healthy volunteers.

