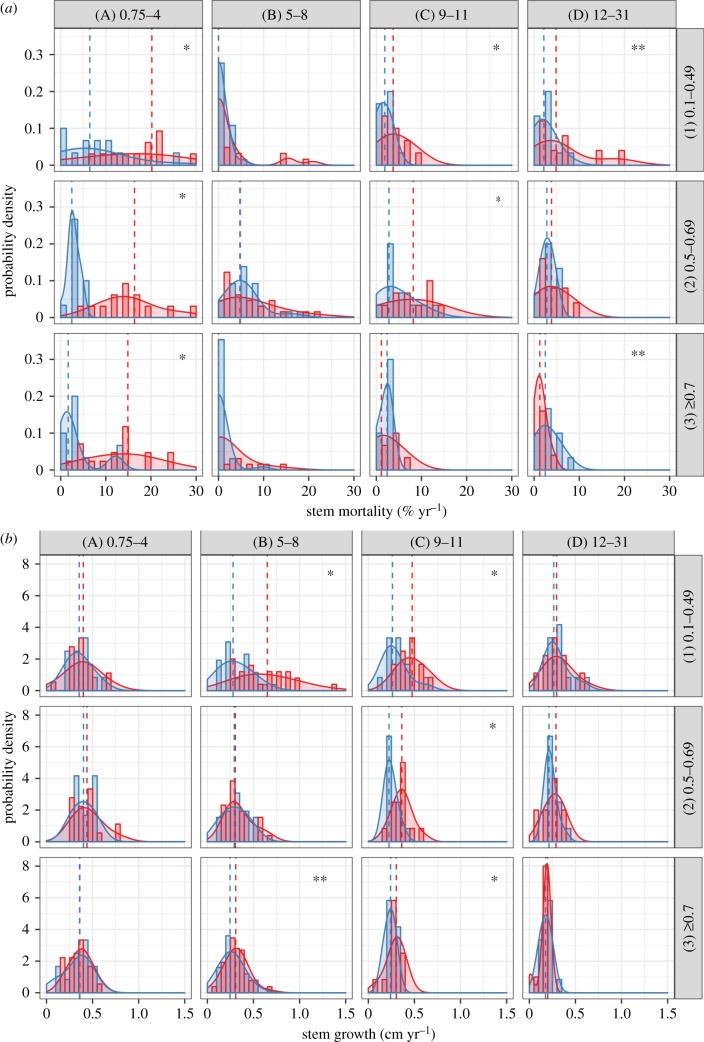
Figure 4.
Probability density function classes of (a) stem mortality in (% yr−1) and (b) stem growth (cm yr−1) by wood density (WD: 0.1–0.49; 0.5–0.69; greater than 0.7 g cm−3) in lines and YSLF classes (0.75–4; 5–8; 9–11; 12–31 years) in columns. Dashed lines represent median, red colour for burned and blue for unburned forests. Significance of Wilcoxon text is represented by: *p < 0.05 and **p < 0.10.

